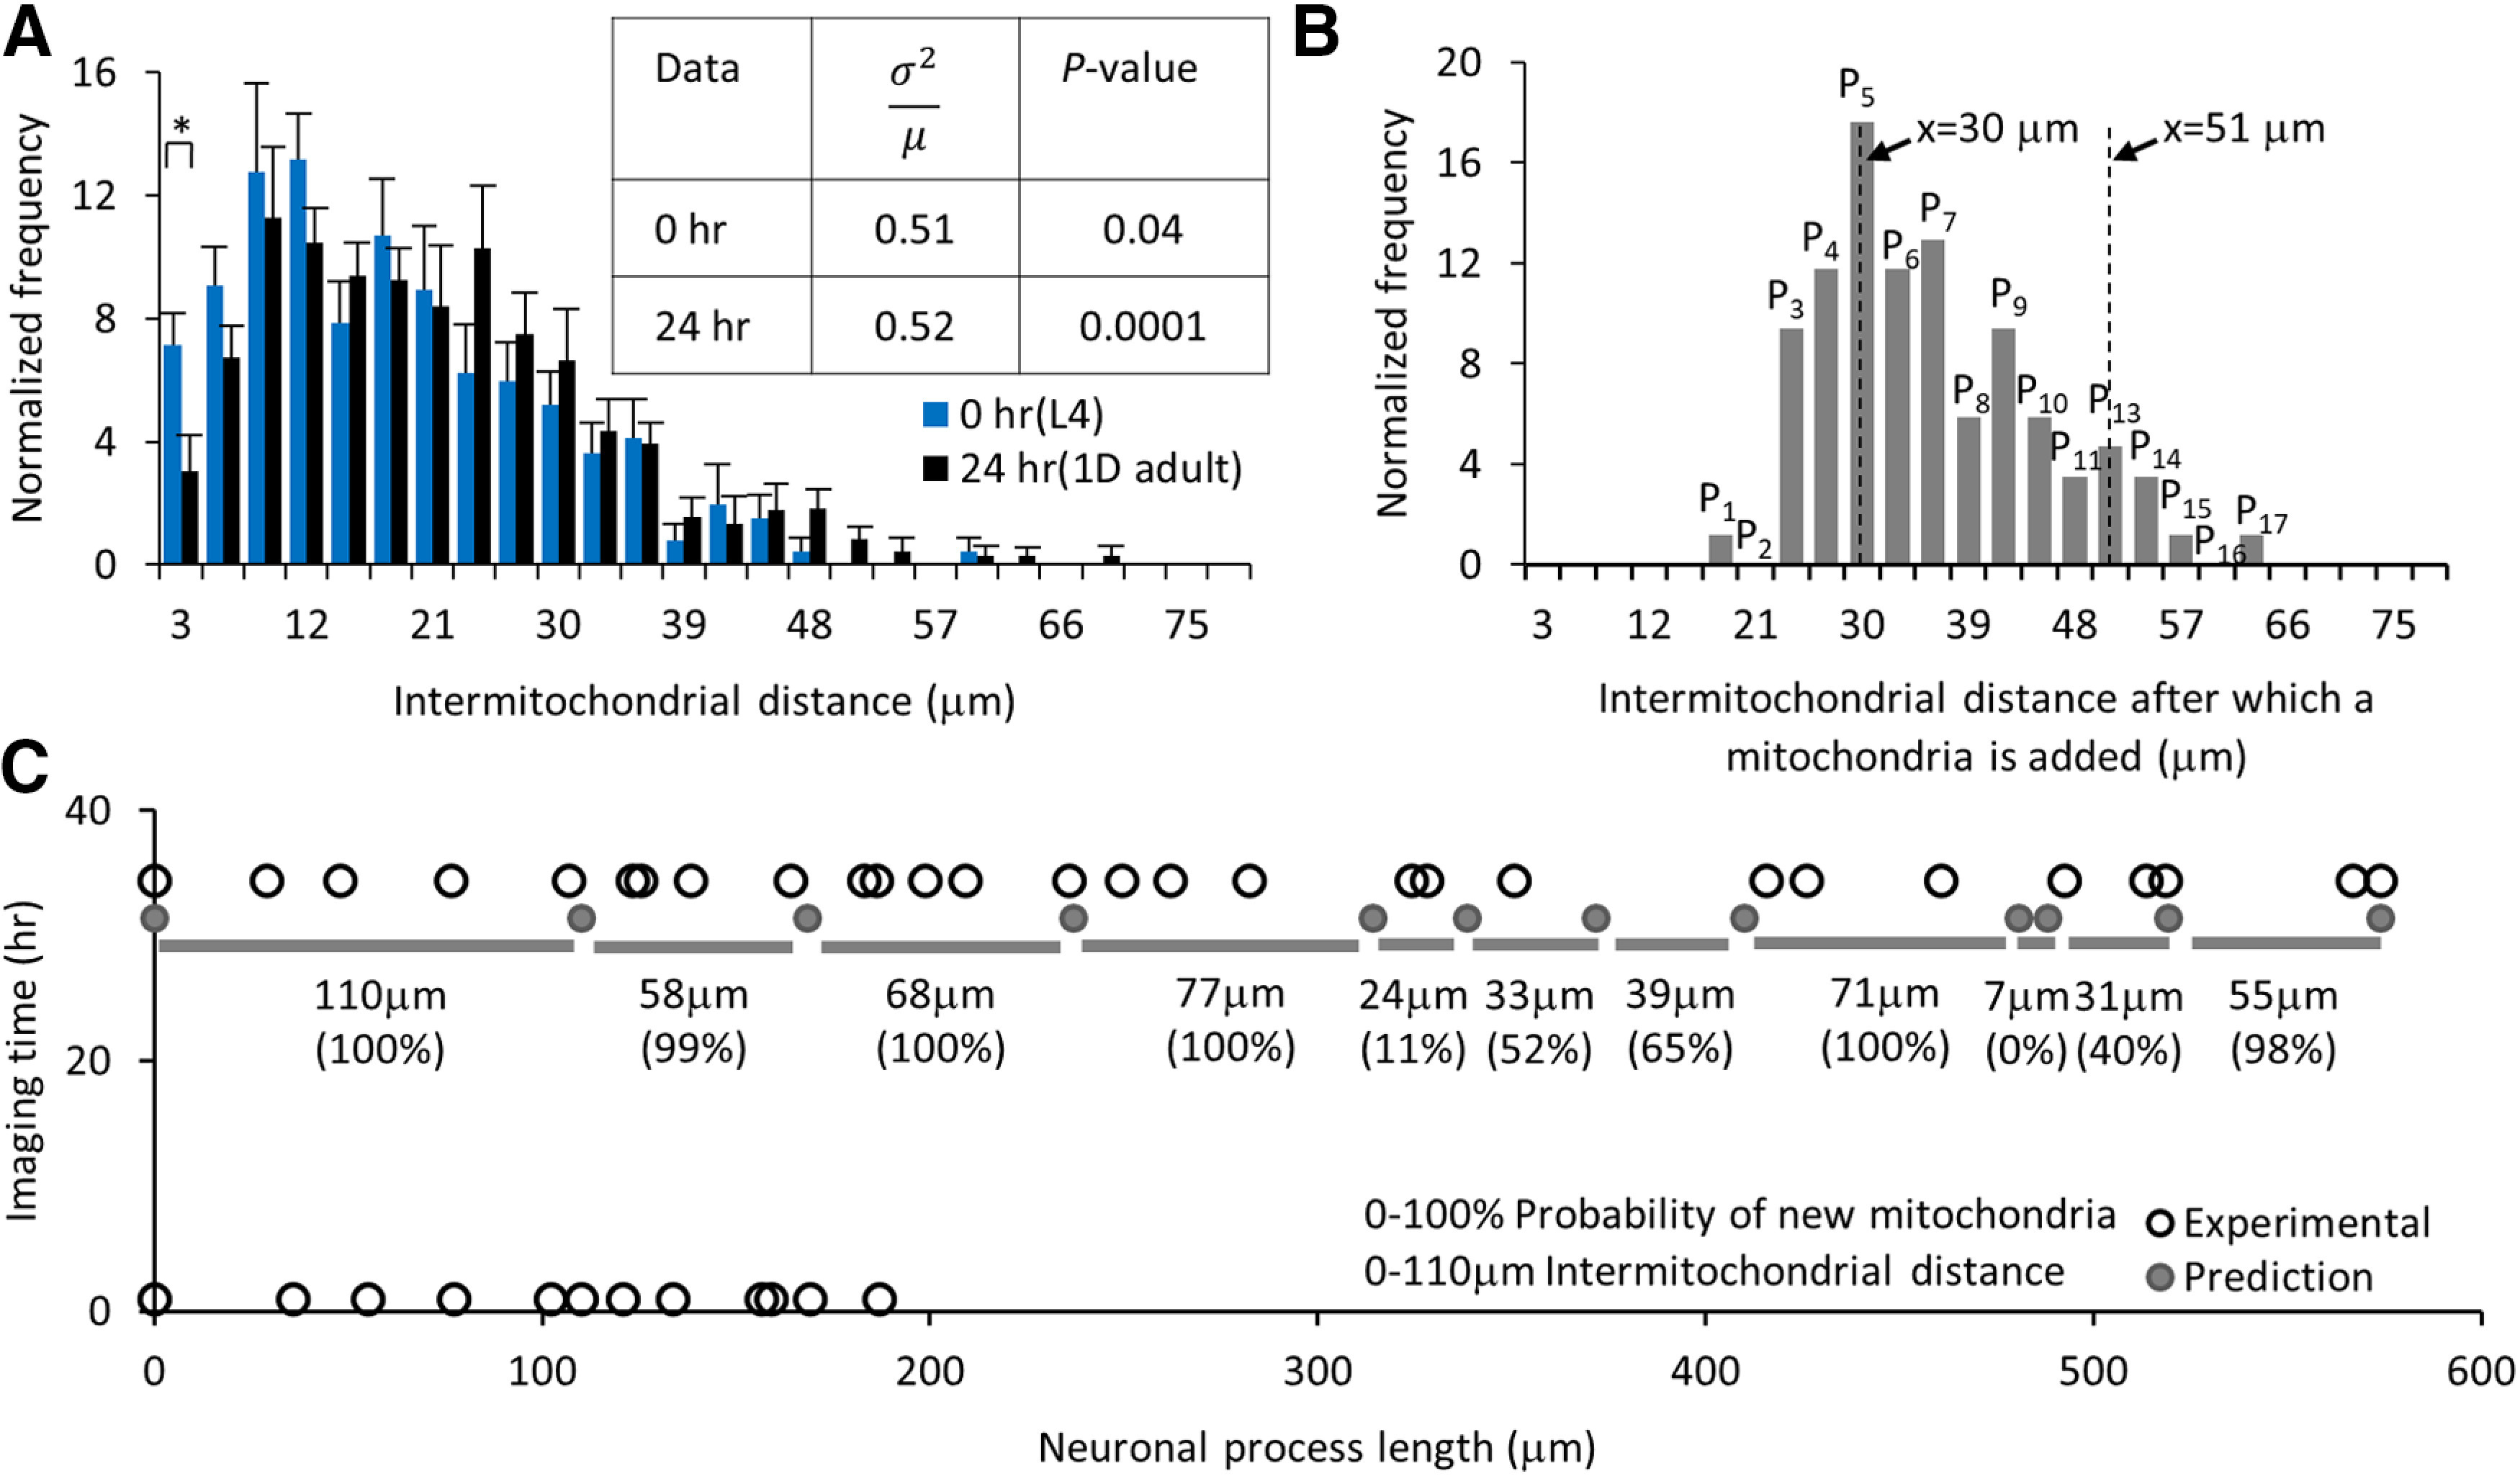
Figure 6.

Experimental probability distribution can predict the addition of new mitochondria in a growing neuronal process. A, Normalized number of intermitochondrial distances at 0 h (L4) and 24 h (1D adult) after the start of imaging. Statistical significance was evaluated by two-sample t test; *p < 0.05 for the first two bars at bins 3 and 6 μm. The table represents the index of dispersion and p value obtained from the goodness of fit estimated using the χ2 analysis against a Poisson distribution for data from 0- and 24-h imaging time points (n = 8 animals each). B, Normalized number of mitochondria addition is calculated from experimental long-term images of individual TRNs (n = 8 animals started at the L4 stage, 85 new mitochondria additions). The probability of new mitochondria added for intermitochondrial distance x = L is shown as PL and can be estimated by summing (, where ). C, The predicted (dark circle) and experimental (open circle) location of mitochondria at 0- and 33-h images of an individual animal. All the 12 positions at t = 33 h are predicted using the locations measured at t = 0 h and total neuronal process elongation values. The intermitochondrial distances (gray bars with the values) are used to predict the addition of new mitochondria between each pair at 33 h. The probability values for finding new mitochondria within the predicted pairs are represented in percentages. Extended Data Figure 6-1 supports this figure.
