Figure 4.

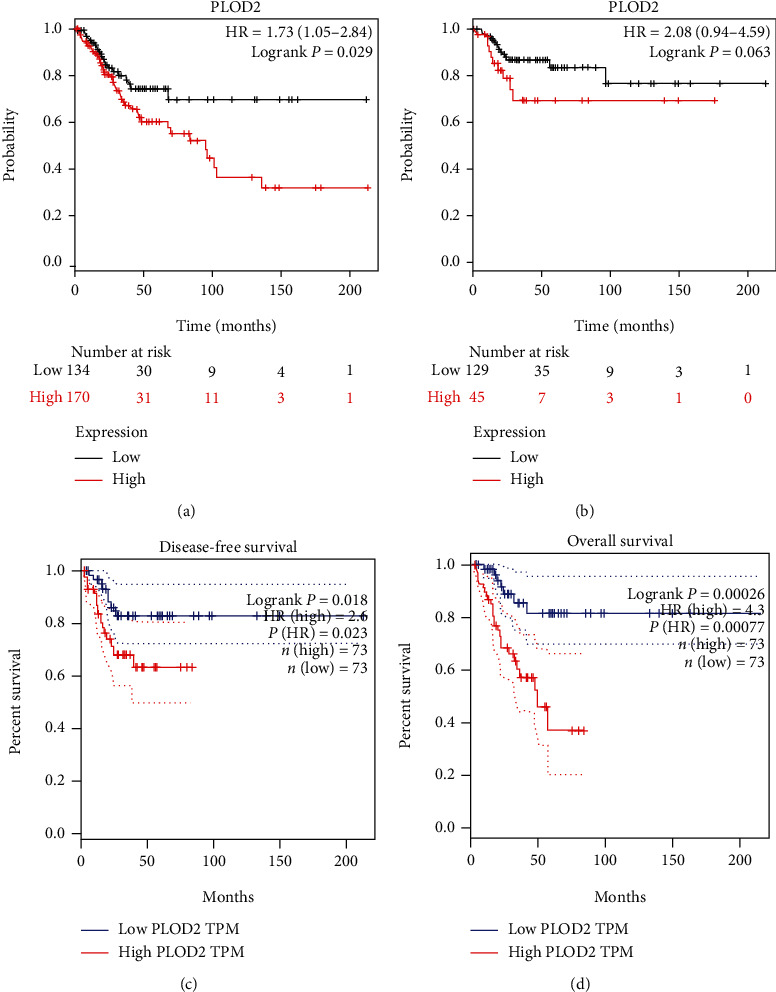
(a, b) High PLOD2 expression was correlated with poor OS in CESC and was not associated with RFS (Kaplan-Meier Plotter). (c, d) High PLOD2 expression was correlated with poor OS and RFS in CESC (GEPIA).

(a, b) High PLOD2 expression was correlated with poor OS in CESC and was not associated with RFS (Kaplan-Meier Plotter). (c, d) High PLOD2 expression was correlated with poor OS and RFS in CESC (GEPIA).