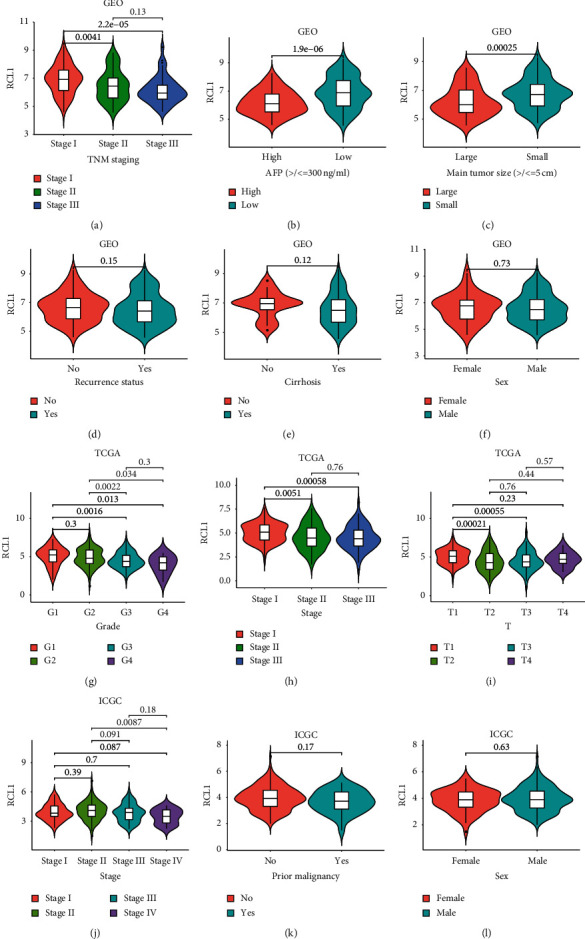
Figure 2.

Correlation analysis between RCL1 expression and clinical characteristics. Expression distribution of RCL1 in different TNM stage (a), AFP group (b), tumor size (c), recur status (d), cirrhosis status (e), and sex (f) based on GEO cohort. The expression of RCL1 in different clinicopathologic grade (g), TNM stage (h), and T stage (i) based on TCGA cohort. RCL1 expression and TNM stage (j), prior malignancy (k), and sex (l) correlation in ICGC cohort.
