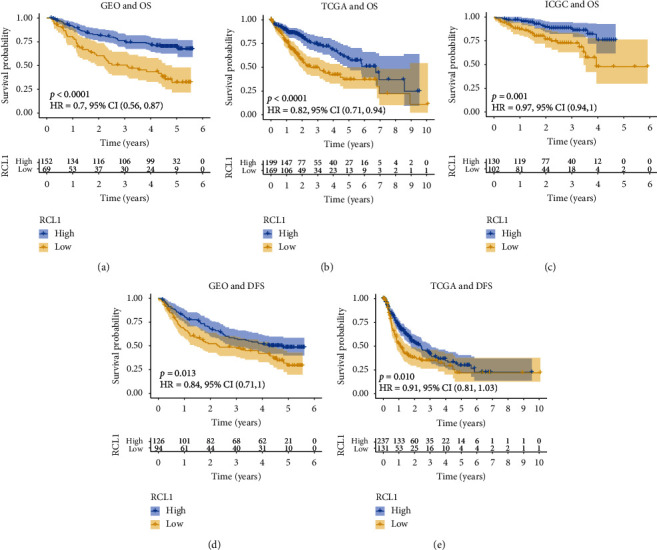
Figure 3.

Overall survival (OS) and disease-free survival (DFS) analysis of RCL1. Kaplan-Meier plot of the correlation between RCL1 aberrant expression and OS in GEO (a), TCGA (b), and ICGC (c) cohorts. Association between RCL1 expression and DFS in GEO (d) and TCGA (e) cohorts.
