
Figure 9.
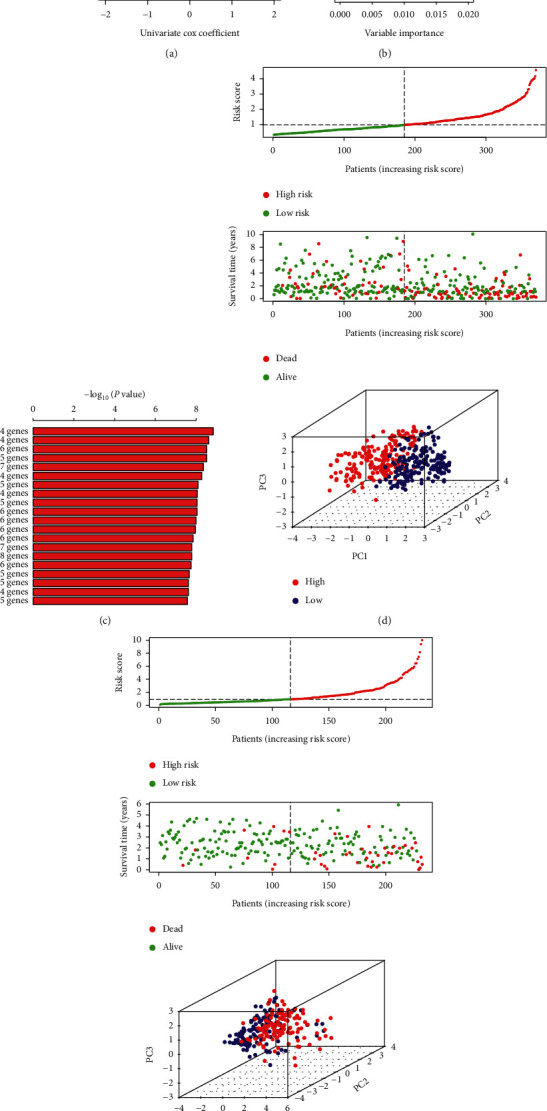
Screen of important genes and construction of gene signature. (a) Volcano plot displayed the survival-related genes through univariate Cox regression analysis. (b) Identification of relative important genes via random survival forest algorithms. (c) Top 20 gene signatures were ranked by –log 10 p value using Kaplan-Meier plotter calculated. The distribution of risk score and survival time in high-risk and low-risk groups in training (d) and validation (e) sets. Principal Component Analysis (PCA) showed the difference between high-risk and low-risk groups.