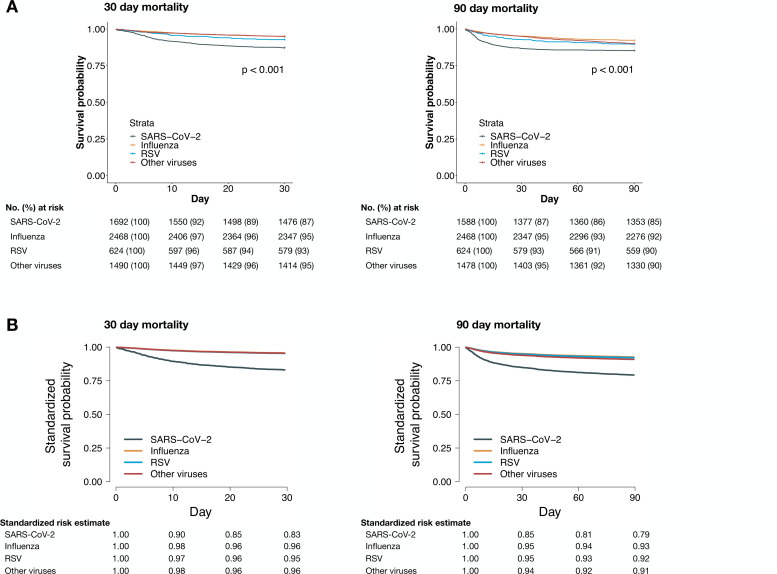
Figure 2.
Unadjusted Kaplan-Meier curves (A) and standardised survival function curves (B) for mortality by virus group. (A) Unadjusted Kaplan-Meier curves and risk tables for 30-day (left) and 90-day (right) mortality. P value represents result of significance testing using log-rank tests. The 30-day mortality Kaplan-Meier curves for the influenza and other viruses groups overlap. (B) Complete case-based standardised survival functions for 30-day (left) and 90-day (right) mortality. For 30-day mortality, complete data were available for 1272 SARS-CoV-2, 2220 influenza, 591 RSV and 1386 other viruses healthcare episodes. For 90-day mortality, complete data were available for 1194 SARS-CoV-2, 2118 influenza, 555 RSV and 1315 other viruses healthcare episodes. The survival functions were all standardised and adjusted for sex, age, BMI category, diabetes, hypertension, cardiac disease, respiratory disease, chronic kidney disease and malignancy as presented in table 1. The 30-day mortality curves for the influenza, RSV and other viruses groups overlap. AdV, adenovirus; BMI, body mass index; BoV, bocavirus; EV, enterovirus; MPV, metapneumoviruses; PIV, parainfluenzaviruses; RSV, respiratory syncytial virus; RV, rhinovirus; sCoV, seasonal coronavirus.

