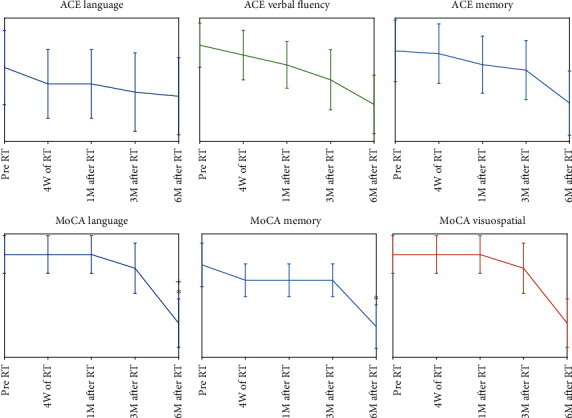
Figure 3.

Plots of the standard error of the mean values of ACE-R (language, verbal fluency, and memory) and MoCA domain scores (language, memory, and visuospatial) at the baseline and 4th week of RT, 1-month, 3-month, and 6-month post-RT. The star markers show significant differences to the baseline, while the plus ones present the significant differences between any parameters to its previous time point.
