
Figure 4.
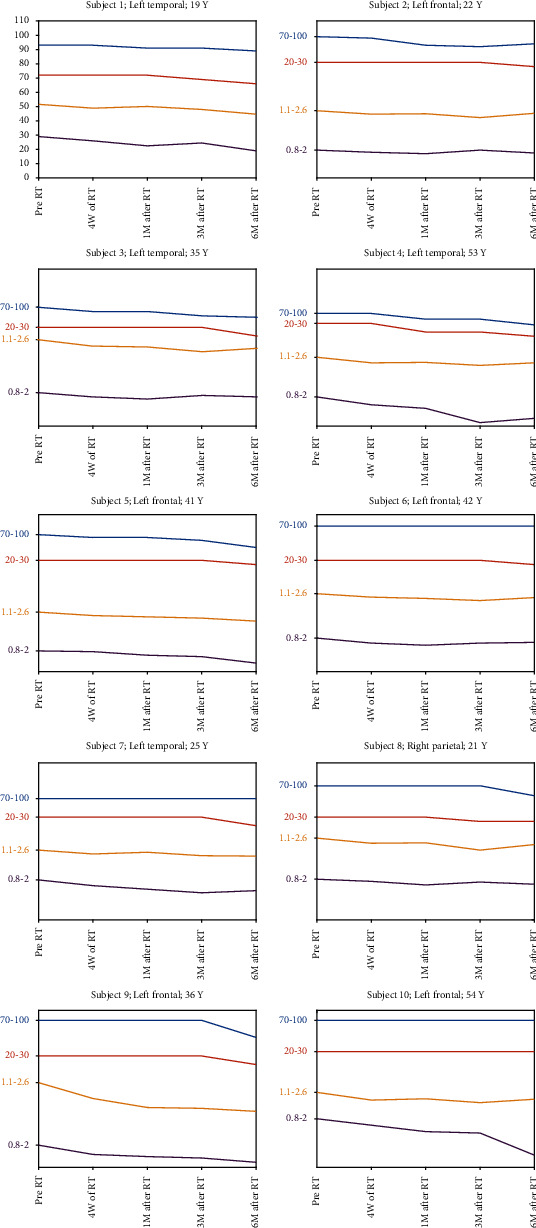
The interval variation of NAA/Cr, Cho/Cr, ACE-R, and MoCA (total scores), from pre-RT up to 6-month post-RT for individual patients. The patient's age along with the location of tumor is indicated above the graphs.
Official websites use .gov
A
.gov website belongs to an official
government organization in the United States.
Secure .gov websites use HTTPS
A lock (
) or https:// means you've safely
connected to the .gov website. Share sensitive
information only on official, secure websites.
The interval variation of NAA/Cr, Cho/Cr, ACE-R, and MoCA (total scores), from pre-RT up to 6-month post-RT for individual patients. The patient's age along with the location of tumor is indicated above the graphs.