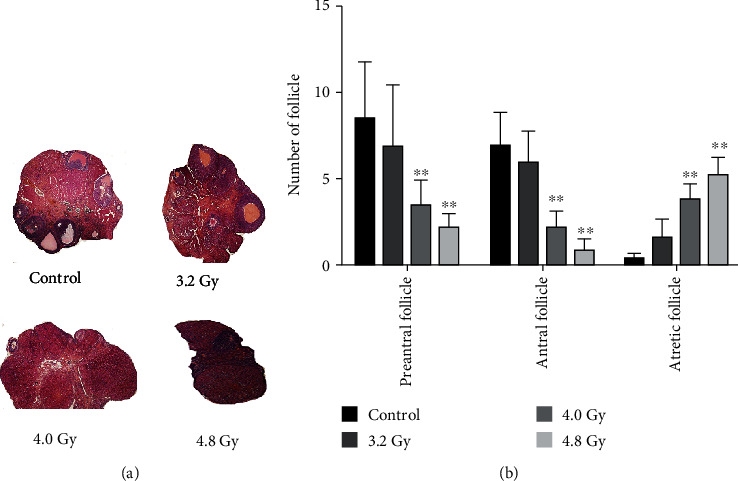
Figure 4.

Ovarian H&E staining. (a) The H&E staining was performed to detect the preantral follicles, antral follicles, and atresia follicles in the model rats (×40). (b) Statistical analysis of the data from the control, 3.2 Gy, 4.0 Gy, and 4.8 Gy groups. Compared with the control and 3.2 Gy groups, ∗∗P < 0.05.
