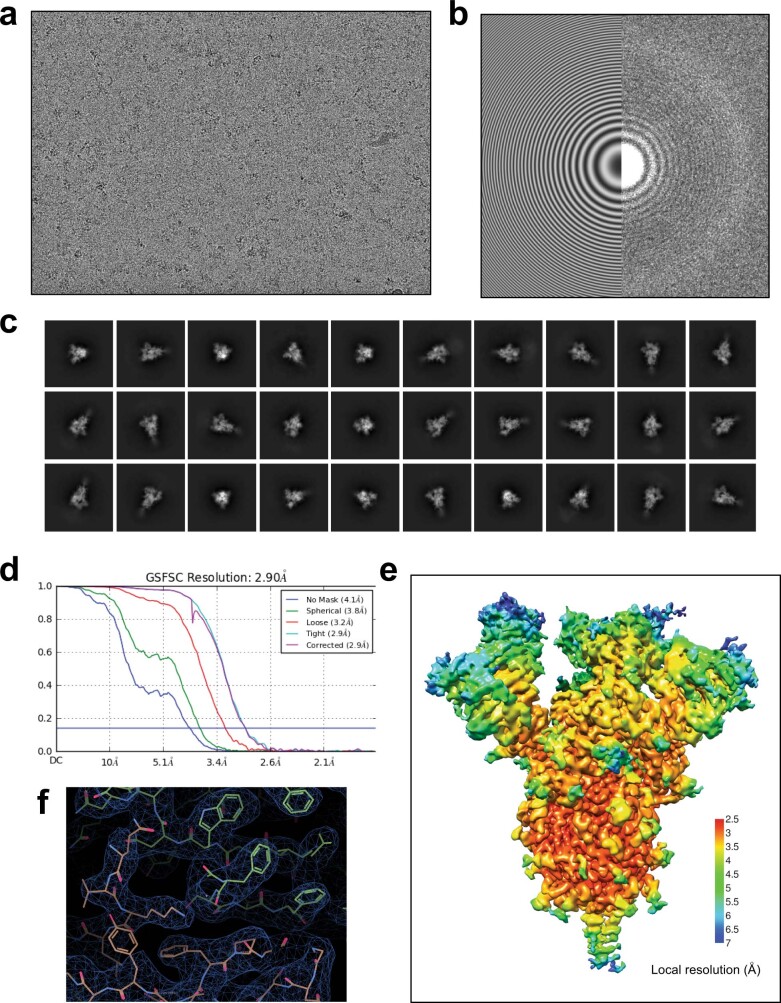
Extended Data Fig. 7. Cryo-EM data processing and validation for Nb12–spike complex.
a, A representative cryo-EM micrograph showing Nb12–spike complex embedded in vitreous ice. b, A contrast-transfer function (CTF) fit of the micrograph. c, Representative 2D average classes. d, Overall resolution estimation (Fourier shell correlation (FSC) of 0.143). e, Local resolution estimation of the cryo-EM map. f, Cryo-EM density and models for an interface region between RBD and Nb12 after local refinement.

