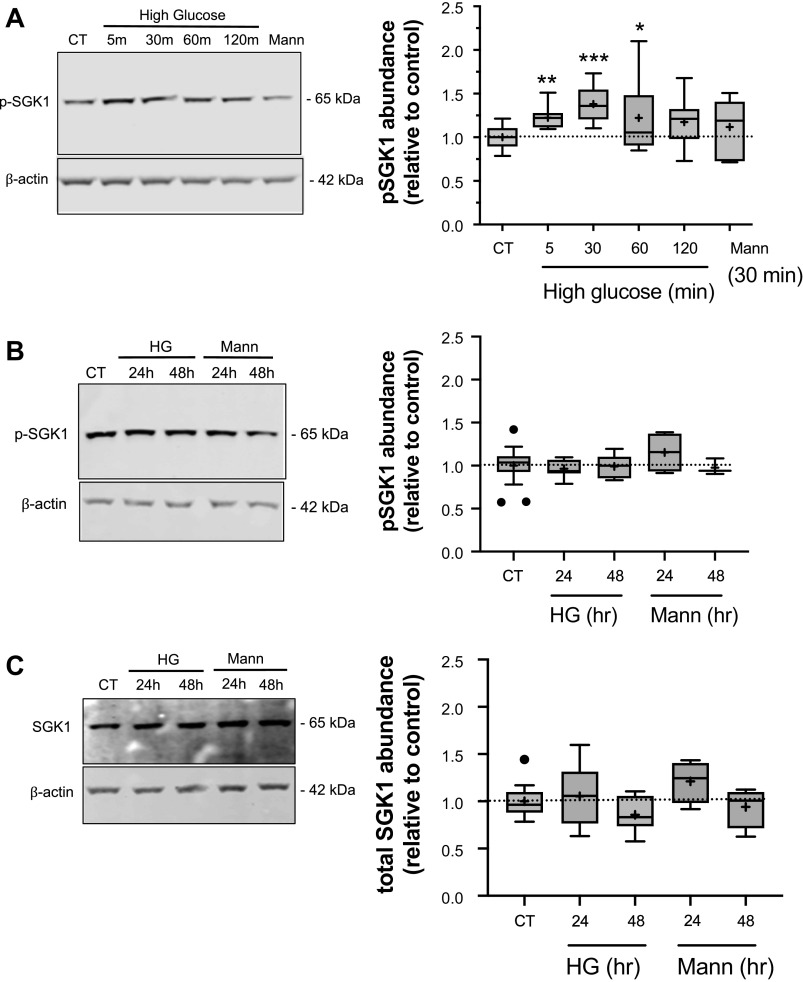
Figure 1.
High glucose treatment increases SGK1 phosphorylation. Bovine CMEC lysates were prepared following high glucose medium exposures and analyzed for abundance of phosphorylated SGK1 (pSGK1) using quantitative Western blot and an antibody specific to phosphorylated Ser422 residues in SGK1. A: Left panel: representative Western blot of pSGK1 abundance in CMEC exposed for 5, 30, 60, or 120 min to high glucose medium (30 mM D-glucose; 325 mOsm medium), 30 min of normoglycemic isosmotic control medium (5 mM glucose; 298 mOsm) or 30 min of osmotic control medium (5 mM D-glucose with 25 mM mannitol; 325 mOsm medium). Right panel: Quantitated abundance of pSGK1 following exposures to high glucose or to the normoglycemic or mannitol osmotic controls. Data are expressed relative to normoglycemic control and are presented as Tukey box and whisker plots showing upper and lower quartiles (top and bottom lines of the box). Median values are shown as the horizontal line in the box. Mean values are indicated by the + sign. N values are 9 for all high glucose exposure times and 6 for the 30 min mannitol control. B: Left panel: representative Western blot of pSGK1 abundance in CMEC exposed for 24 or 48 h to high glucose medium, mannitol osmotic control or to 24 h normoglycemic control media. Right panel: Quantitated abundance of pSGK1 following 24 and 48 h exposures to high glucose, mannitol osmotic control media, or normoglycemic control media. Data are expressed relative to normoglycemic control and are presented as Tukey box and whisker plots. N values are 8 each for 24 and 48 h high glucose, 4 for 24 h mannitol and 3 for 48 h mannitol. C: Left panel: representative Western blot of total SGK1 abundance (i.e., both non-phosphorylated and phosphorylated SGK1) in CMEC exposed to 24 or 48 h of high glucose or mannitol osmotic control or to 24 h normoglycemic control. Right panel: Quantitated abundance of total SGK1 following 24 and 48 h exposures to high glucose or mannitol control (n values are 8, 8, 4, 4 respectively). Data are expressed relative to normoglycemic control and are presented as Tukey box and whisker plots. Asterisks indicate values significantly different than control by Kruskal-Wallis test *P < 0.05, **P < 0.01, ***P < 0.001.

