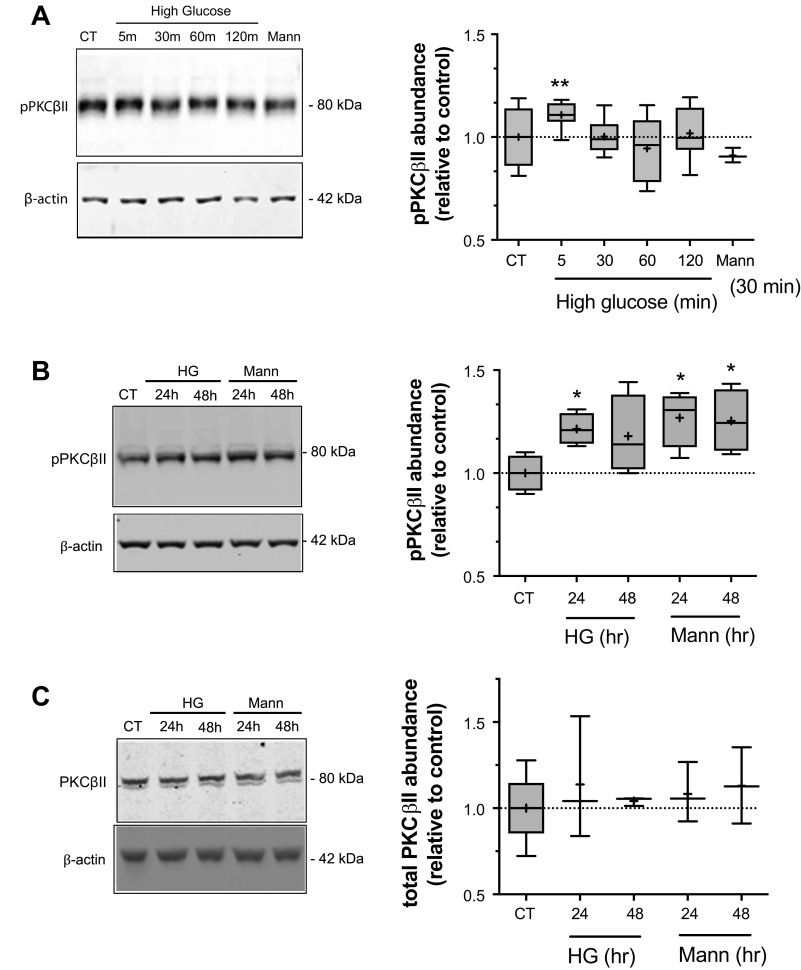
Figure 2.
High glucose treatment increases PKCβII phosphorylation. Bovine CMEC lysates were prepared following high glucose medium exposures and analyzed for abundance of phosphorylated PKCβII (p-PKCβII) using quantitative Western blot and an antibody specific to phosphorylated Ser660 residues in PKCβII. A: Left panel: representative Western blot of p-PKCβII abundance in CMEC exposed for 5, 30, 60, or 120 min to high glucose medium (30 mM D-Glucose; 325 mOsm medium), 30 min of normoglycemic control medium (5 mM glucose; 298 mOsm) or 30 min of osmotic control medium (5 mM D-Glucose with 25 mM Mannitol; 325 mOsm medium). Right panel: Quantitated abundance of p-PKCβII following exposures to high glucose or to the normoglycemic or mannitol osmotic controls. Data are expressed relative to normoglycemic control and are presented as Tukey box and whisker plots. n values are 5 for all high glucose exposure times and 3 for the 30 min mannitol control. B: Left panel: representative Western blot of p-PKCβII abundance in CMEC exposed for 24 or 48 h to high glucose medium, mannitol osmotic control or to 24 h normoglycemic control media. Right panel: Quantitated abundance of p-PKCβII following 24 and 48 h exposures to high glucose, mannitol osmotic control media, or normoglycemic control media. Data are expressed relative to normoglycemic control and are presented as Tukey box and whisker plots. n values are 4 for all conditions. C: Left panel: representative Western blot of total PKCβII abundance (i.e., both non-phosphorylated and phosphorylated PKCβII) in CMEC exposed to 24 or 48 h of high glucose or mannitol osmotic control or to 24 h normoglycemic control. Right panel: Quantitated abundance of total SGK1 following 24 and 48 h exposures to high glucose or mannitol control (n values are 3 for all conditions). Data are expressed relative to normoglycemic control and are presented as Tukey box and whisker plots. Asterisks indicate values significantly different than control by Kruskal-Wallis test: *P < 0.05, **P < 0.01.

