
Figure 5.
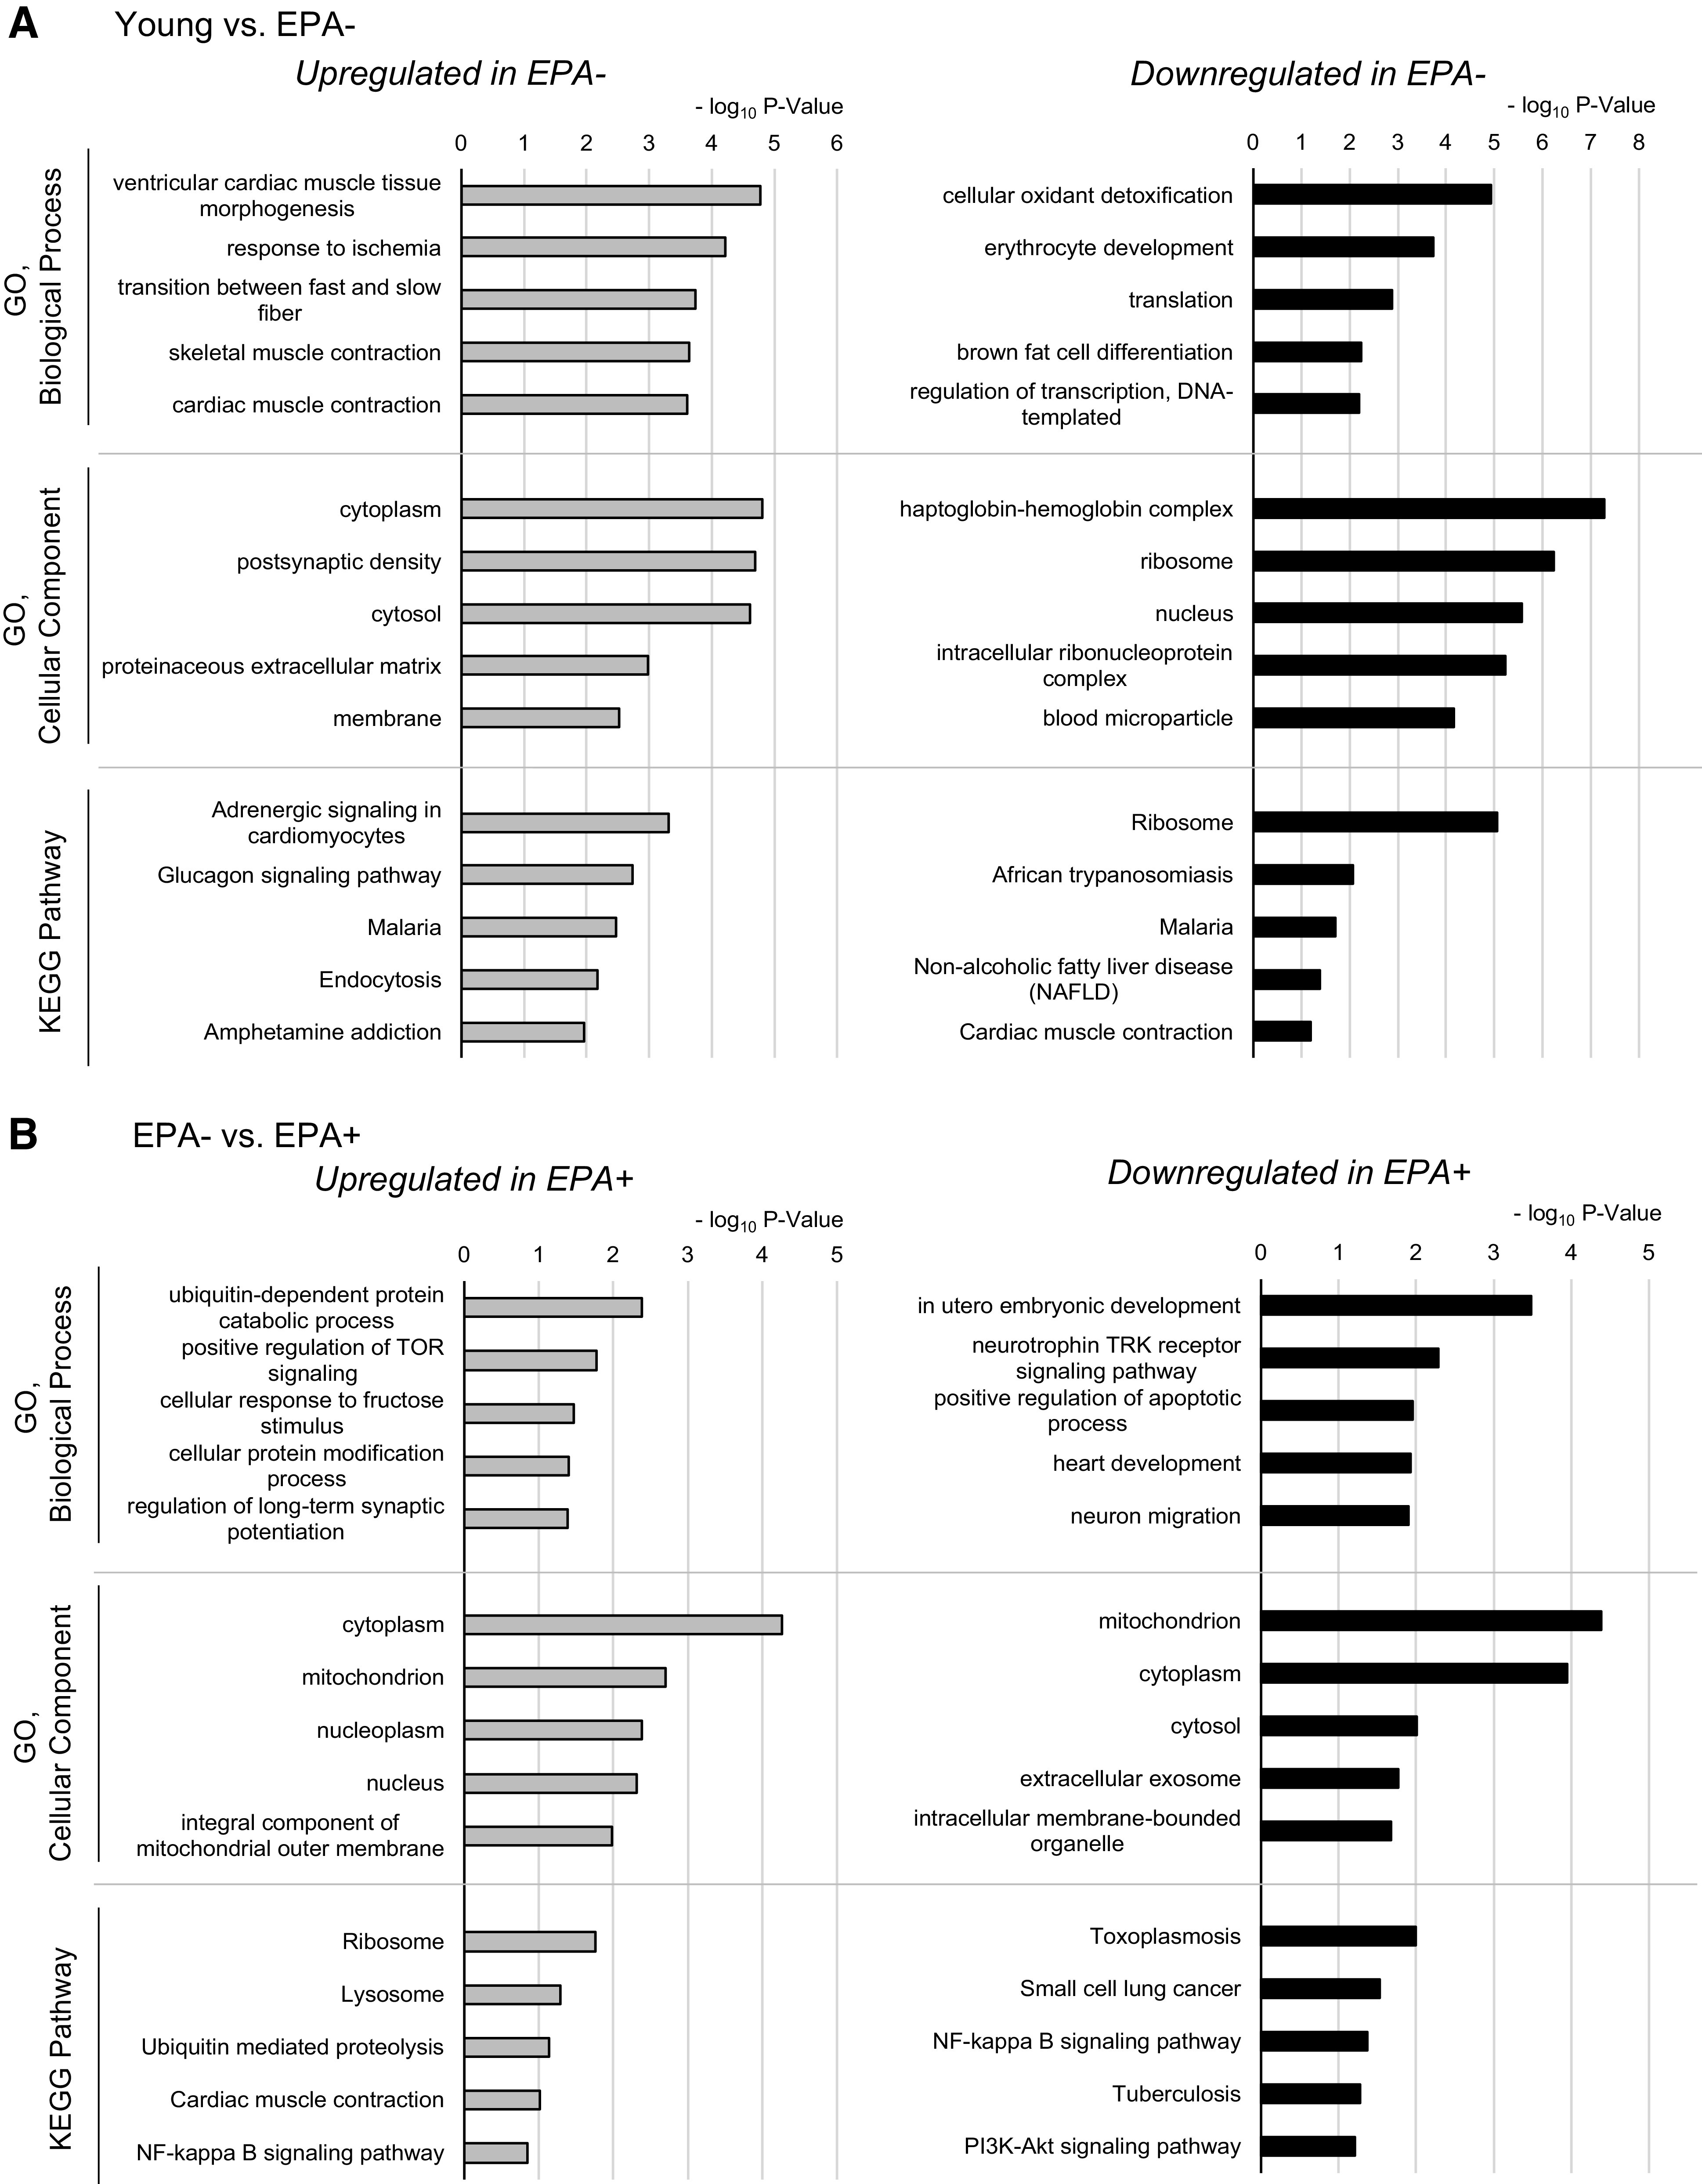
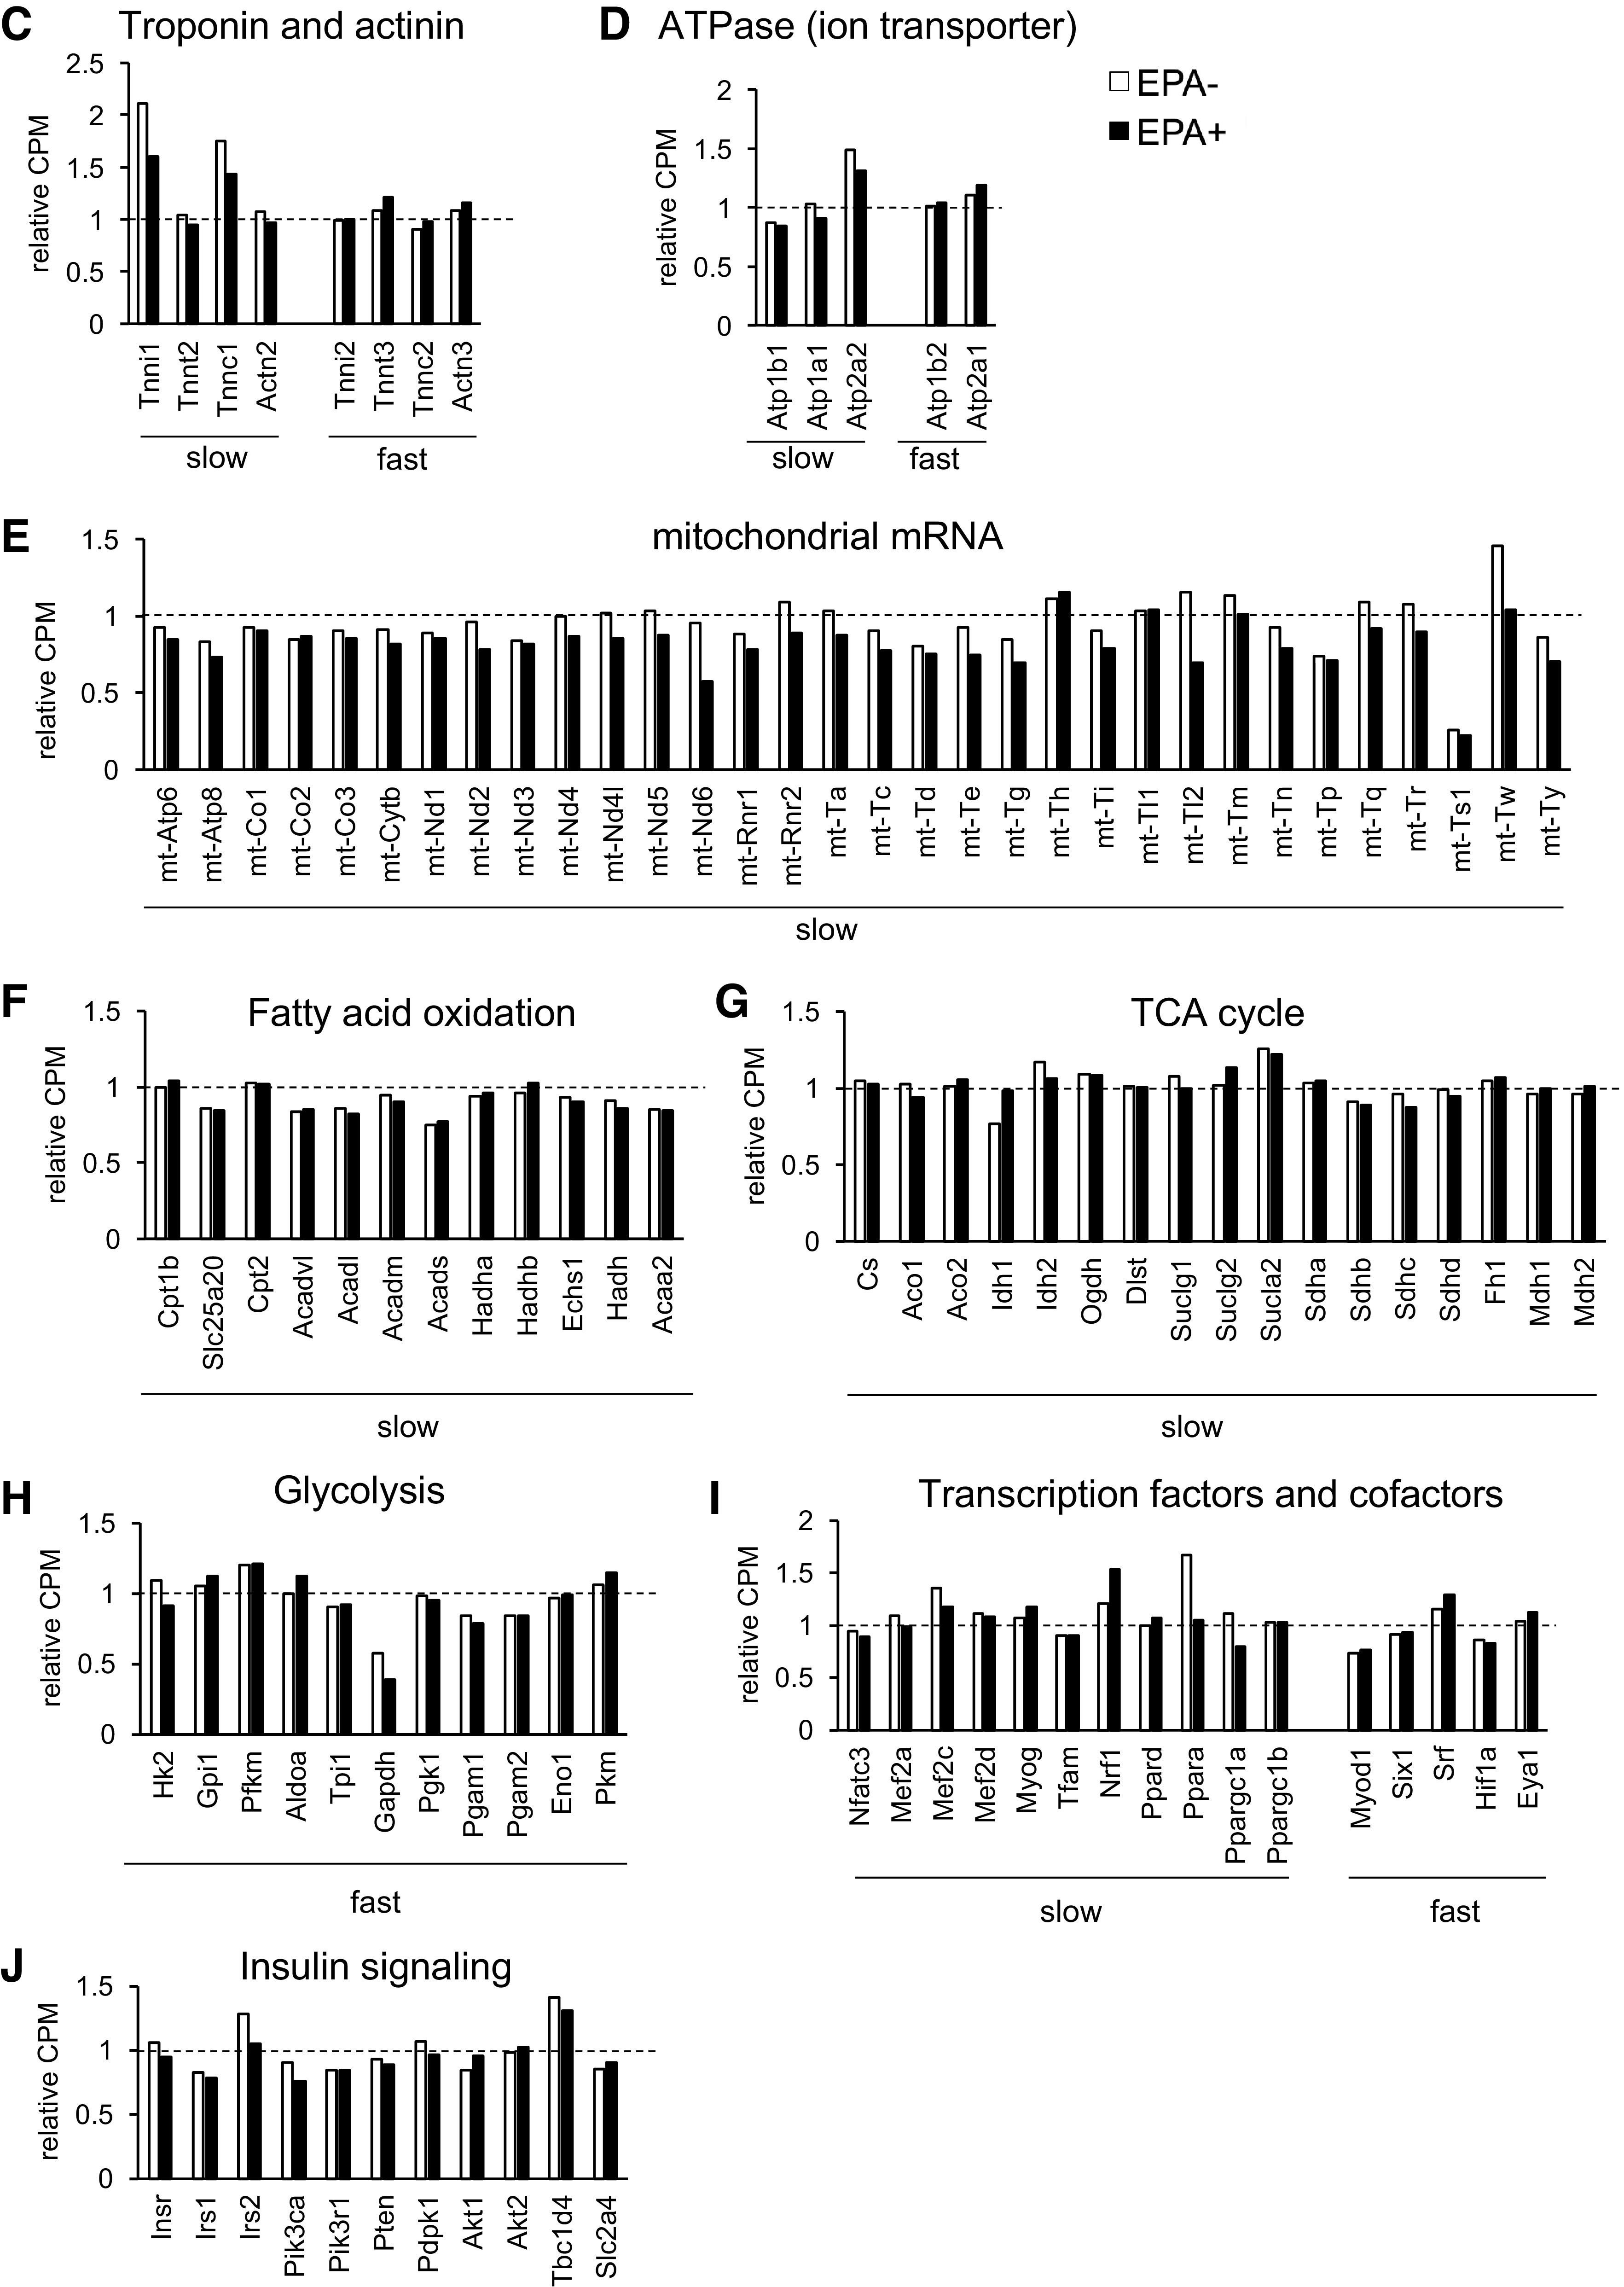
Transcriptomic analysis of skeletal muscle validates fast-to-slow fiber type transition in aging muscle and its inhibition by EPA. RNA samples were extracted from Gas + Pl muscle from Young, EPA−, and EPA+, and pooled samples comprising equal amounts of each sample (Young, n = 3; EPA−, n = 6; EPA+, n = 6) were used for RNA sequencing. A and B: comparisons were performed in Young versus EPA− (A) and EPA− versus EPA+ (B). Upregulated or downregulated gene sets were determined using NOISeq, followed by GO enrichment or KEGG pathway analysis. The top five terms enriched in each category are represented with the bar graphs of negative log10-transformed P values. Expressions of genes related to fiber types or signaling pathways are shown; troponin and actinin (C), ATPase (ion transporter) (D), mitochondrial mRNA (E), fatty acid oxidation (F), TCA cycle (G), glycolysis (H), transcription factors and cofactors (I), and insulin signaling (J). Data indicate the counts per million (CPM) presented as fold change relative to that in Young. EPA, eicosapentaenoic acid; GO, Gene Ontology; KEGG, Kyoto Encyclopedia of Genes and Genomes.