Figure 3.
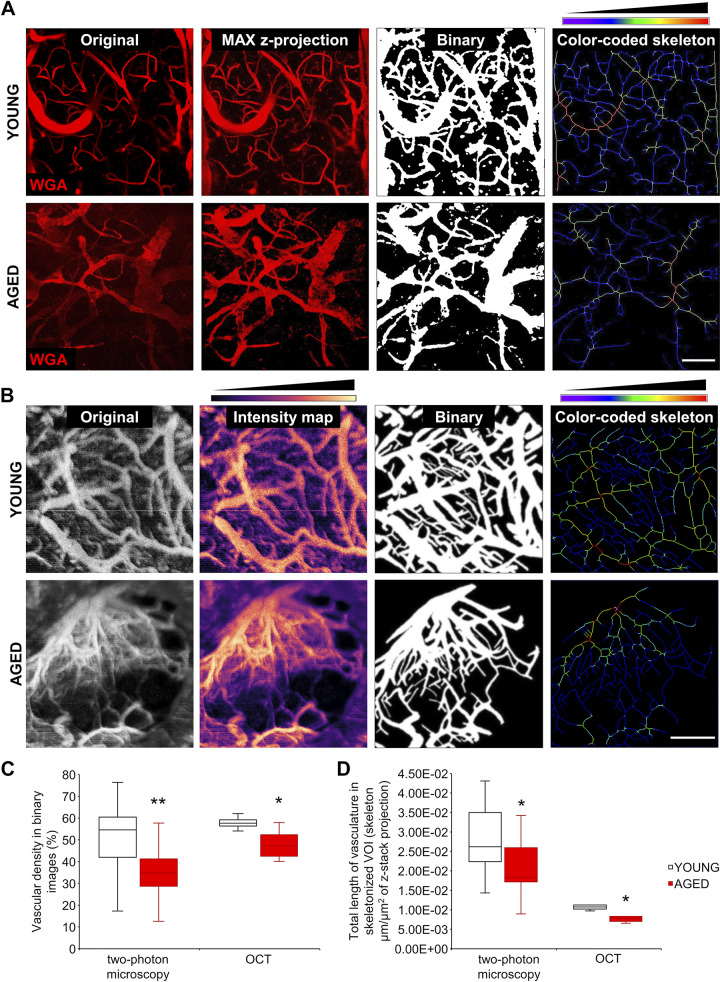
Demonstration of age-related cerebromicrovascular rarefaction by intravital two-photon microscopy (MP) and optical coherence tomography (OCT). A: segmentation of blood vessels in two-photon images. Original z-stack images captured in brains of young and aged mice (red fluorescence: wheat germ agglutinin (WGA)-Alexa 594 staining of the glycocalyx of the endothelial cells) were maximally projected and processed with a modified macro from a published ImageJ plugin (see materials and methods). Thresholded images and color-coded skeleton images were used to calculate indexes corresponding to microvascular density. In the color-coded skeleton images, the pixel colors correspond to the relative vascular diameters. Scale bar, 100 μm. B: segmentation of blood vessels in brain parenchyma on OCT images. Original z-stack images acquired in brains of young and aged mice were maximally projected and processed with the same macro as the two-photon images. Thresholded binary images and color-coded skeletons were used to calculate indexes corresponding to microvascular density. Scale bar, 1 mm. C: quantification of the vascular density index, which is the ratio of the vasculature area to total imaged area (volume of interest, VOI). Aging was associated with a significant decline in the vascular density index, calculated on the basis of both the two-photon images and the OCT images (MP: P = 0.0022, n = 26/12; OCT: P = 0.0235, n = 5/5). D: quantification of the vascular length density index, which is the total length of vasculature in skeletonized images in skeleton of the z-stack projection image area (μm/μm2). Aging was associated with a significant decline in the vascular length density index, calculated either using the two-photon images or the OCT images (MP: P = 0.01, n = 25/20; OCT: P = 0.016, n = 5/5). Data are presented as interquartile distributions with median. *P < 0.05, **P < 0.01 compared with young group.

