Figure 5.
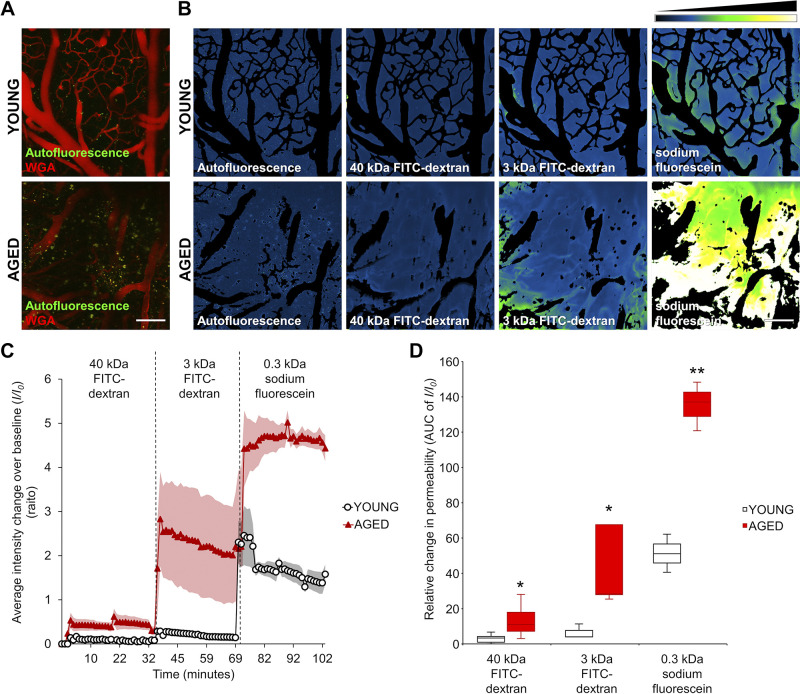
Demonstration of age-related blood-brain barrier (BBB) disruption by two-photon imaging-based measurement of microvascular permeability to fluorescent tracers in a volume of brain tissue. A: z-stack projection of cerebral vasculature in young and aged mice. Red fluorescence: wheat germ agglutinin (WGA)-Alexa 594 staining of the glycocalyx of the endothelial cells. Green autofluoresent background in the tracer channel is shown. Scale bar, 100 μm. B: changes in tracer fluorescence intensity in the extravascular space and brain parenchyma of young and aged animals upon injection of the fluorescent tracers of different molecular mass. Images captured subsequent to tracer administrations were maximally projected (z-stack), and subtraction of the images of WGA-Alexa 594-stained vasculature was performed. Intensity plots derived from median projection of time stacks of the parenchymal recordings show increased extravasation of tracers of different molecular masses in brains of aged mice compared with those of young mice. Relative fluorescence intensity scale is shown at top right. Scale bar, 100 μm. C: time course of sequential increases in fluorescence intensity in the extravascular space in a volume of brain parenchyma upon injection of the fluorescent tracers of decreasing molecular mass, indicating tracer extravasation. Note the increased extravasation of fluorescent tracers in brains of aged mice compared with those in young controls. Note the more pronounced extravasation of tracers with decreasing molecular mass. Bolus injection of tracer was followed by a relatively fast increase in fluorescence intensity, which then reached a plateau phase. Data are presented as means ± SE. D: semiquantitative analysis of microvascular permeability to fluorescent tracers with different molecular masses in brains of young and aged mice. For the purpose of this analysis, the respective areas under these 32-min-long interval curves (AUC) presented in C were used as indexes for relative permeability of the microvasculature to each of the tracers injected. The AUC-based permeability indexes were calculated for both groups and are presented as a boxplot (interquartile distributions with median) (young vs. aged animals 40 kDa: P = 0.0427, young n = 5, aged n = 6; 3 kDa: P = 0.036, young n = 3, aged n = 5; SF: P = 0.0011, young n = 3, aged n = 3; note that animals with saturated staining were removed for correct quantification). Note the increased permeability for each different-sized tracers in aged animals compared with that in young mice. *P < 0.05, **P < 0.01 compared with young group.

