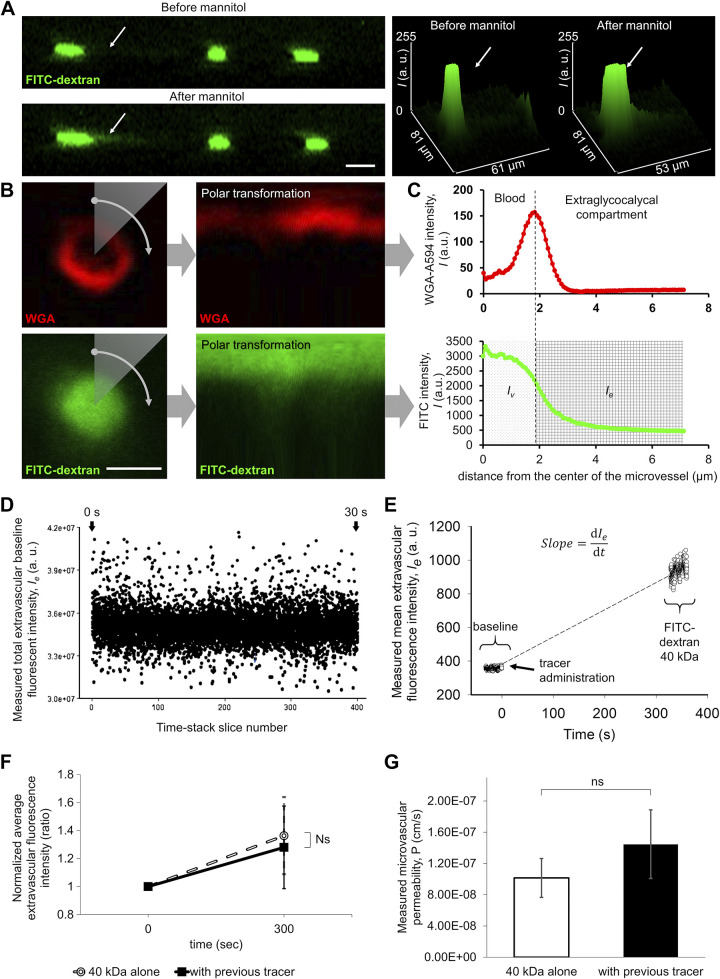
Figure 6.
Two-photon imaging-based measurement of permeability of single microvessels to fluorescent tracers. A: representative recording showing focal microvascular leakage induced by mannitol treatment. The mouse brain cortex was imaged by two-photon microscopy before (top) and after (bottom) 20% mannitol administration. Z-stacks were reassembled and resliced as a z→y transition to visualize microvascular leaks. Green fluorescence: FITC-dextran 500 kDa. Note that this large tracer is exclusively located in the intravascular compartment before mannitol administration. Arrow points to a localized increase in extravascular tracer fluorescence intensity in response to mannitol, corresponding to focal disruption of the blood-brain barrier (BBB). Right: 3-D plots showing tracer fluorescence intensity in the z dimension before and after mannitol treatment. Scale bar, 10 μm. B: cortical microvessel recording for permeability measurement. Images from microvessel cross-sections were captured at the same depth as the cortical volume imaging (50–150 μm from the brain surface); 400 images were recorded during ∼32 s with high magnification, high speed, roundtrip mode of the two-photon microscope and images were averaged (see D) as a time stack projection in each case. Red fluorescence: wheat germ agglutinin (WGA)-Alexa 594 staining of the glycocalyx of the endothelial cells. Green fluorescence: FITC-Dextran 40-kDa tracer. Right: the Cartesian-to-polar transformation of the images are shown. The image fluorescence intensities are plotted as a function of radial position for a given polar angle. Scale bar, 4 μm. C: method for quantification of extravasated tracer fluorescence intensities in the surroundings of a single microvessel. The fluorescence intensities of polar converted images are plotted as a function of distance from the center of the microvessel. Note that the signal maximum of the red fluorescence of the WGA-Alexa 594-stained glycocalyx on a radial intensity profile defines the border between the intravascular compartment and the extraluminal/extravascular (i.e., extraglycocalycal) compartment. Bottom: the radial intensity profile of the tracer (FITC-dextran 40 kDa). On the basis of the previously determined edge of the intravascular compartment (dashed line), the distribution of the intravascular and extraluminal tracer intensities can be assessed. D: representative recording showing distribution of measured total extravascular baseline intensity as a function of time. The source of this variability, in part, is flowing blood cells. To control for this variability in fluorescence intensity, average time stack projections were made from each recording. E: representative recording showing changes in extravascular tracer intensity after injection of FITC-dextran 40 kDa in an aged mouse. Extravasated tracer fluorescence intensity was calculated from every image from a time stack before and after tracer injection, and results were plotted as a function of time. The slope of the trend line is a main component of the permeability measurement formula (see Fig. 7.). F: previous injection of the 500-kDa tracer does not affect the extravascular fluorescence intensity postinjection of the 40-kDa tracer (P = 0.59, n = 6). Data are presented as means ± SE. G: calculated permeability of 40-kDa tracer with and without previously injected 500-kDa tracer, showing no significant difference (P = 0.41, n = 6). After image analysis, the permeability was calculated with the formula shown in Fig. 7.

