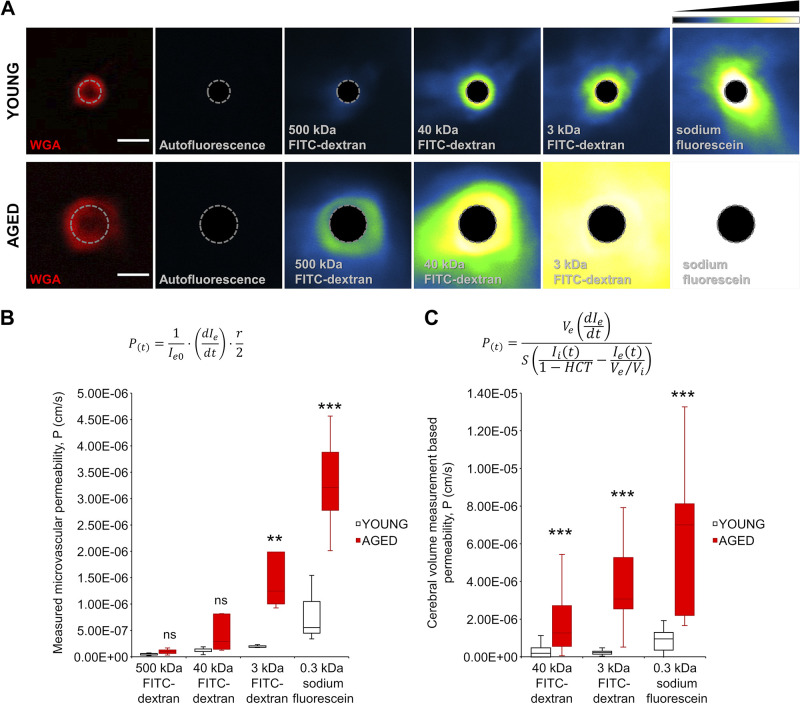
Figure 7.
Comparison of blood-brain barrier (BBB) permeability to different size tracers in young and aged mice. A: representative two-photon images showing measurement of the permeability of single microvessels in brains of young and aged animals. First panels show cross-sections of microvessels (red fluorescence: wheat germ agglutinin (WGA)-Alexa 594 (WGA-A594) staining of the glycocalyx of the endothelial cells; autofluorescence: baseline fluorescence in the tracer channel; dashed line: border between intravascular and extraluminal compartments based on WGA-Alexa 594 (WGA-A594) signal maximum) in brains of a young and an aged animal. Recorded images were average projected at time points corresponding to the time periods postadministration of fluorescent tracers of different molecular masses. Shown are average signal intensity projections by tracers in single microvessels in the young and aged mouse brains. Note the increased extravasation of tracers of different molecular masses in brains of aged mice compared with those of young mice. Relative fluorescence intensity scale is shown at top right. Note that in case of sodium fluorescein (SF) the intensity in aged animals was often over the dynamic range. Scale bar, 4 μm. B: boxplots are summary data\ showing increased calculated microvascular permeability in the aged mouse brain compared with young controls. After image analysis, the permeability was calculated with the formula indicated above the boxplot, where Ie0 is baseline extravascular intensity; dIe/dt is the slope of the intensity shift after tracer administration (see Fig. 6E); and r is the radius of the vessel calculated from the maximum intensity based on the radial intensity profile of WGA-A594-stained images. All data are presented as interquartile distributions with median (young vs. aged animals 500 kDa: ns, young n = 5, aged n = 4; 40 kDa: ns, young n = 6, aged n = 5; 3 kDa: P = 0.009, young n = 3, aged n = 4; SF: P = 0.00002, young n = 3, aged n = 5). *P < 0.05, **P < 0.01, ***P < 0.001 young vs. aged. C: boxplots are summary data for cumulative microvascular permeability, calculated on the basis of two-photon imaging of extravasation of fluorescent tracers in a volume of brain tissue (see Fig. 4). After image analysis, the permeability was calculated with the formula indicated above the boxplot, where Ve is the extravascular volume; Vi is the intravascular volume, both calculated based on vascular density in the volume of interest (VOI); dIe/dt is the slope of the intensity shift after tracer administration; S is the approximation of the surface area of the vasculature also calculated from the vascular density of the VOI; Ii (t) is the normalized intravascular fluorescent intensity at an exact time point; Ie(t) is the normalized extravascular or parenchymal fluorescent intensity at an exact time point, both based on the measured integrated density of the analyzed images VOI; and HCT is the hematocrit value, what was taken as constant at 0.42 based on data from the literature. All data are presented as interquartile distributions with median [(young vs. aged animals 40 kDa: P < 0.000001 young n = 48 (from 4 animals), aged n = 90 (from 6 animals); 3 kDa: P < 0.000001, young n = 45 (from 3 animals), aged n = 58 (from 4 animals); SF: P < 0.000001, young n = 44 (from 3 animals), aged n = 45 (from 3 animals)]. Please note that measurement artifacts as outliers of the curve in given time points were removed from the analysis to evade false-positive significance). **P < 0.01, ***P < 0.001 aged vs. young.

