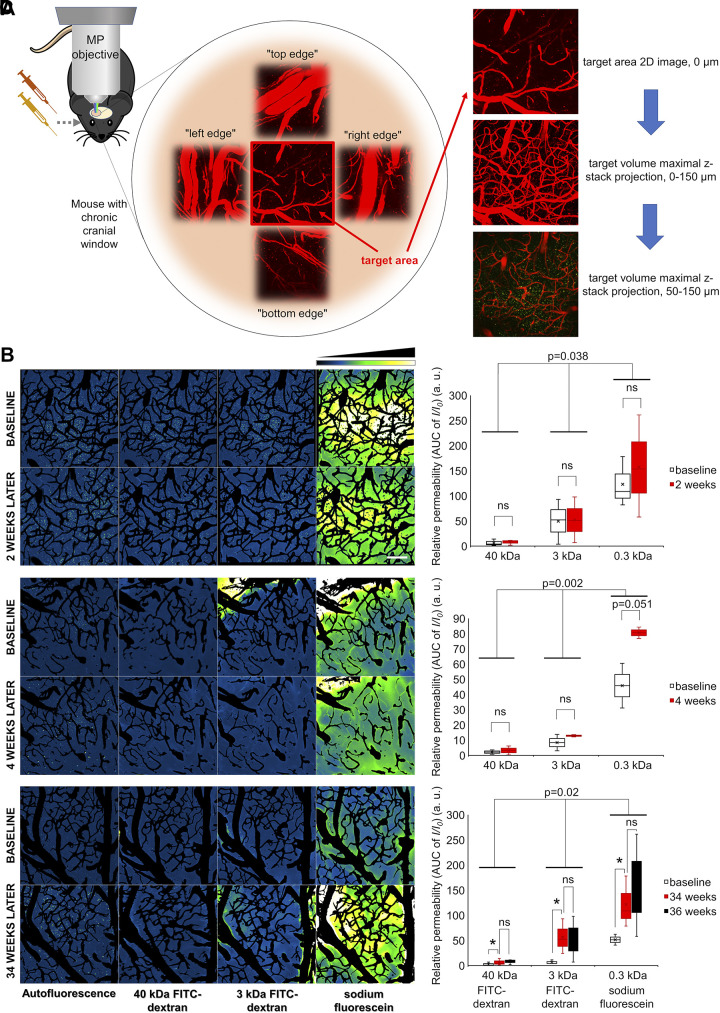
Figure 9.
Longitudinal tracking of blood-brain barrier (BBB) permeability. A: reconnaissance of vascular anatomy during intravital microscopy for longitudinal tracking. Target area was chosen, and surrounding vascular anatomy was recorded for determining targeting aids for recurring measurement. Target area was measured based on the image subtraction analysis method described above. B–D: longitudinal tracking of BBB permeability. Representative z-stack projections of the cerebral vasculature in the same brain area obtained at baseline and after a time interval of 2 wk (B), 4 wk (C), and 34 wk (D). Tracer fluorescence intensities in the extravascular space and brain parenchyma in the same area upon injection of the fluorescent tracers of different molecular mass are shown. Images captured subsequent to tracer administrations were maximally projected (z-stack), and subtraction of the images of wheat germ agglutinin (WGA)-Alexa 594 stained vasculature was performed. Intensity plots derived from median projection of time stacks of the parenchymal recordings are shown. Relative fluorescence intensity scale is shown at top right. Scale bar, 100 μm. Right: quantitative analysis of microvascular permeability to fluorescent tracers with different molecular masses in brains during longitudinal tracking. Relative permeability values were calculated and normalized for the first baseline measurement. Note that, after 2 (B, right) and 4 wk (C, right), there are no significant differences in tracer extravasation compared with baseline. In contrast, BBB permeability to each tracer significantly increased over a 32-wk-long time period (Fig. 9D, right; P = 0.04, n = 3). In pairwise comparison, there was significant difference between baseline and 34 mo (P = 0.04), but no significant difference between the data measured 2 wk later (P = 0.7). The results of two-way ANOVA revealing significant differences between time points and the different size tracers are indicated in the plots. All data are presented as interquartile distributions with median. *P < 0.05, **P < 0.01, ***P < 0.001.

