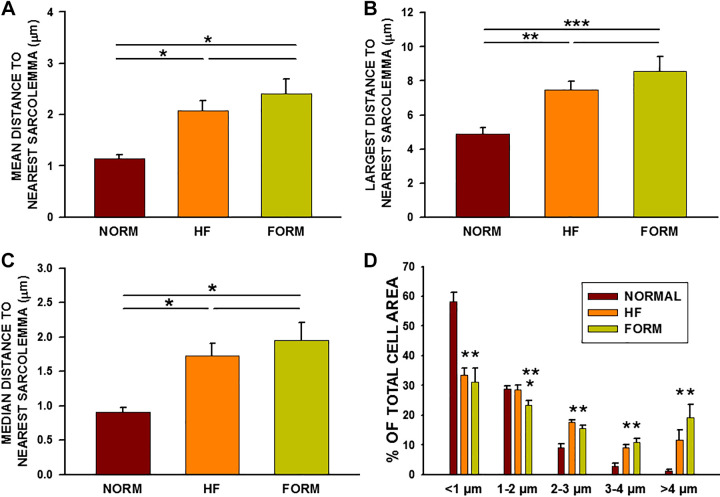
Figure 3.
Summary of distance mapping in normal, heart failure (HF), and formamide (FORM) detubulated dog ventricular myocytes (VMs). A: average distance to nearest sarcolemma for all myocytes from each experimental group. B: greatest distance measured for each group. C: median distance to nearest sarcolemma. D: percentage of total cell area for each distance. A–C: *P < 0.05. **P < 0.01; ***P < 0.001. D: P < 0.05, compared with normal VMs (NVMs); **P < 0.01, compared with HFVMs. Data were compared using a single-tailed ANOVA with a Dunn’s or Holm-Sidak tests for secondary comparisons; n = 14 myocytes in 8 dogs (NVM), 13/5 (HFVM), and 10/3 (FORM VM).

