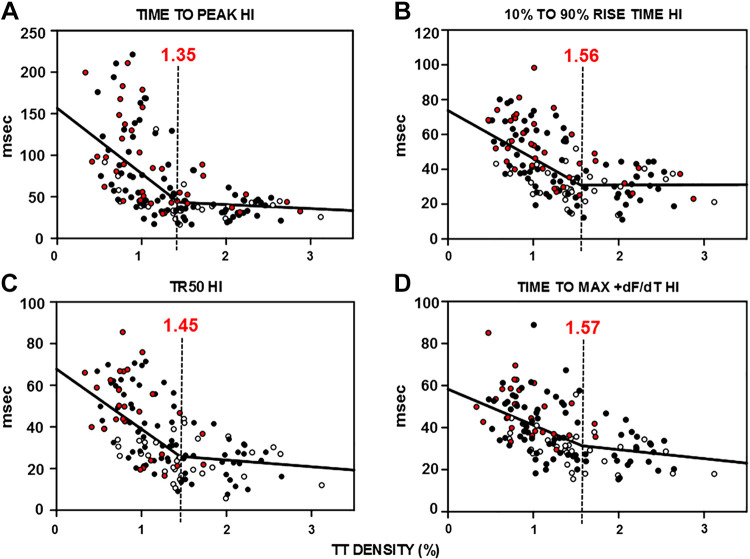
Figure 5.
Relationships between t-tubule (TT) density and heterogeneity index (HI) of Ca2+ release properties and the concept of TT reserve. Summary graphs for all myocytes showing the relationship between TT density and HI for time to peak (A), rise time (B), time to 50% of release (TR50; C), and time to maximum dF/dt (D). Each graph was fitted to a double linear curve with the inflection point indicated by the dashed vertical line with the TT density indicated in red above each line; n = 32–33 in 5 dogs [normal ventricular myocyte (VM), open circles], 26–28 in 3 dogs (heart failure VM, red filled circles), and 75–77 in 7 dogs (formamide VM, black filled circles).

