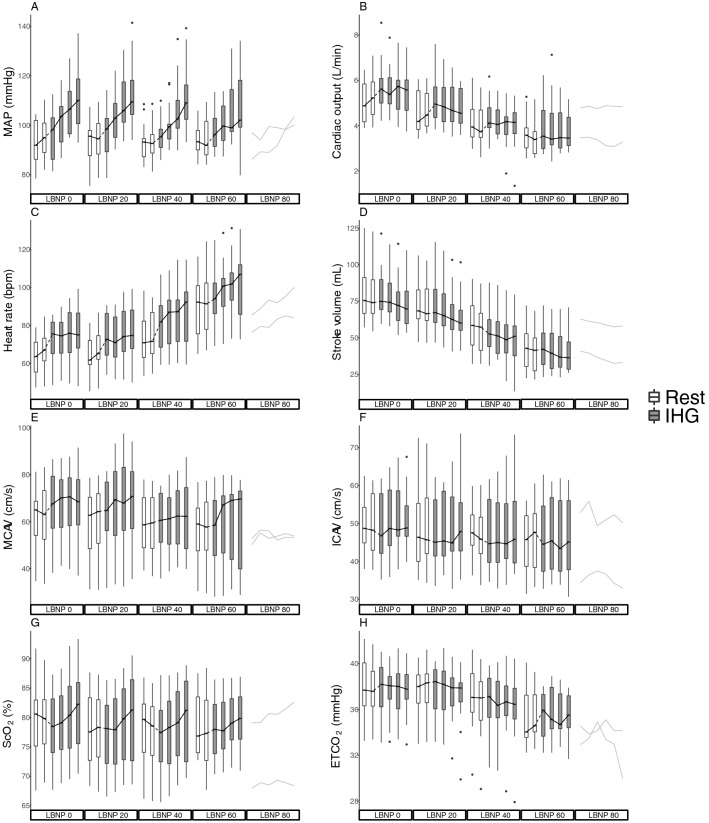
Fig. 2.
a Mean arterial pressure (MAP), b cardiac output, c heart rate, d stroke volume, e middle cerebral artery velocity (MCAV), f internal carotid artery velocity (ICAV), g cerebral oxygen saturation (ScO2) and h end-tidal carbon dioxide (ETCO2) on all lower body negative pressure (LBNP) levels. At LBNP 80, data from the two subjects completing the level are displayed. Boxes are median and 25th and 75th percentiles. Whiskers are × 1.5 interquartile range. Black dots are outliers. White boxes represent rest periods and gray boxes are isometric hand grip (IHG) periods. Of note, at every other LBNP level, alternating within subject, IHG was performed before rest

