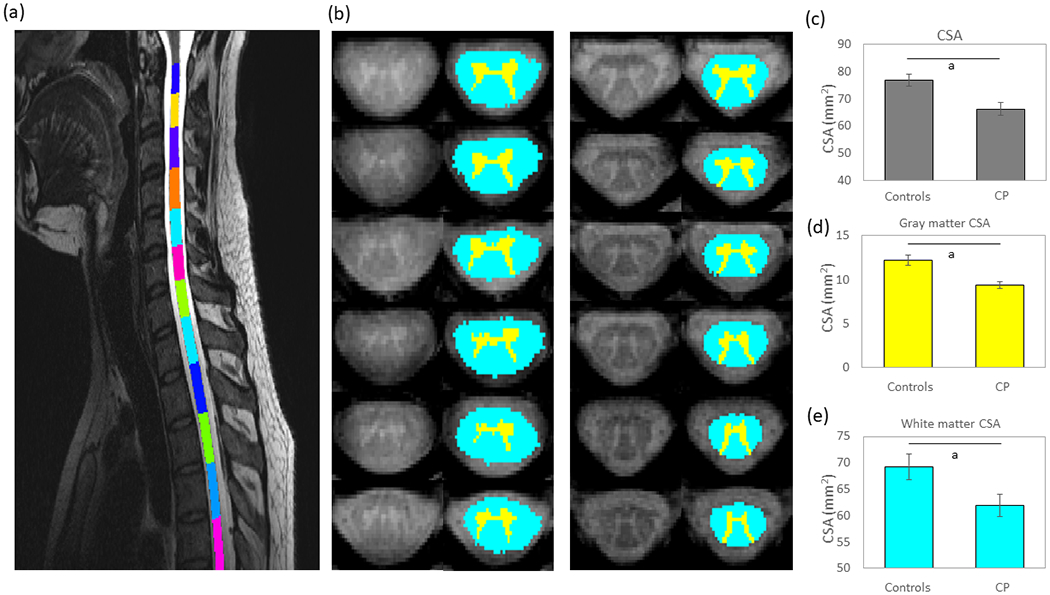
Figure 1:

(a) The sagittal view of the cervical-thoracic spinal cord segmentation for a single representative adult with cerebral palsy (CP). (b) Parcellations of the cross-sectional area (CSA) from C6 to T3 for a representative adult participant with CP (left) and population norm adult control (right). The aqua represents white matter while the yellow represents gray matter. (c) Average spinal cord CSA for the adults with CP and adult controls. The CSA was significantly less for the adults with CP. (d) Average gray matter CSA for the adults with CP and adult controls. As shown, the CSA was significantly less for the adults with CP. (e) Average white matter CSA for the adults with CP and controls. The white matter CSA was also significantly less for the adults with CP. Bar graphs represent the mean and the standard error of the mean. ap≤0.05.
