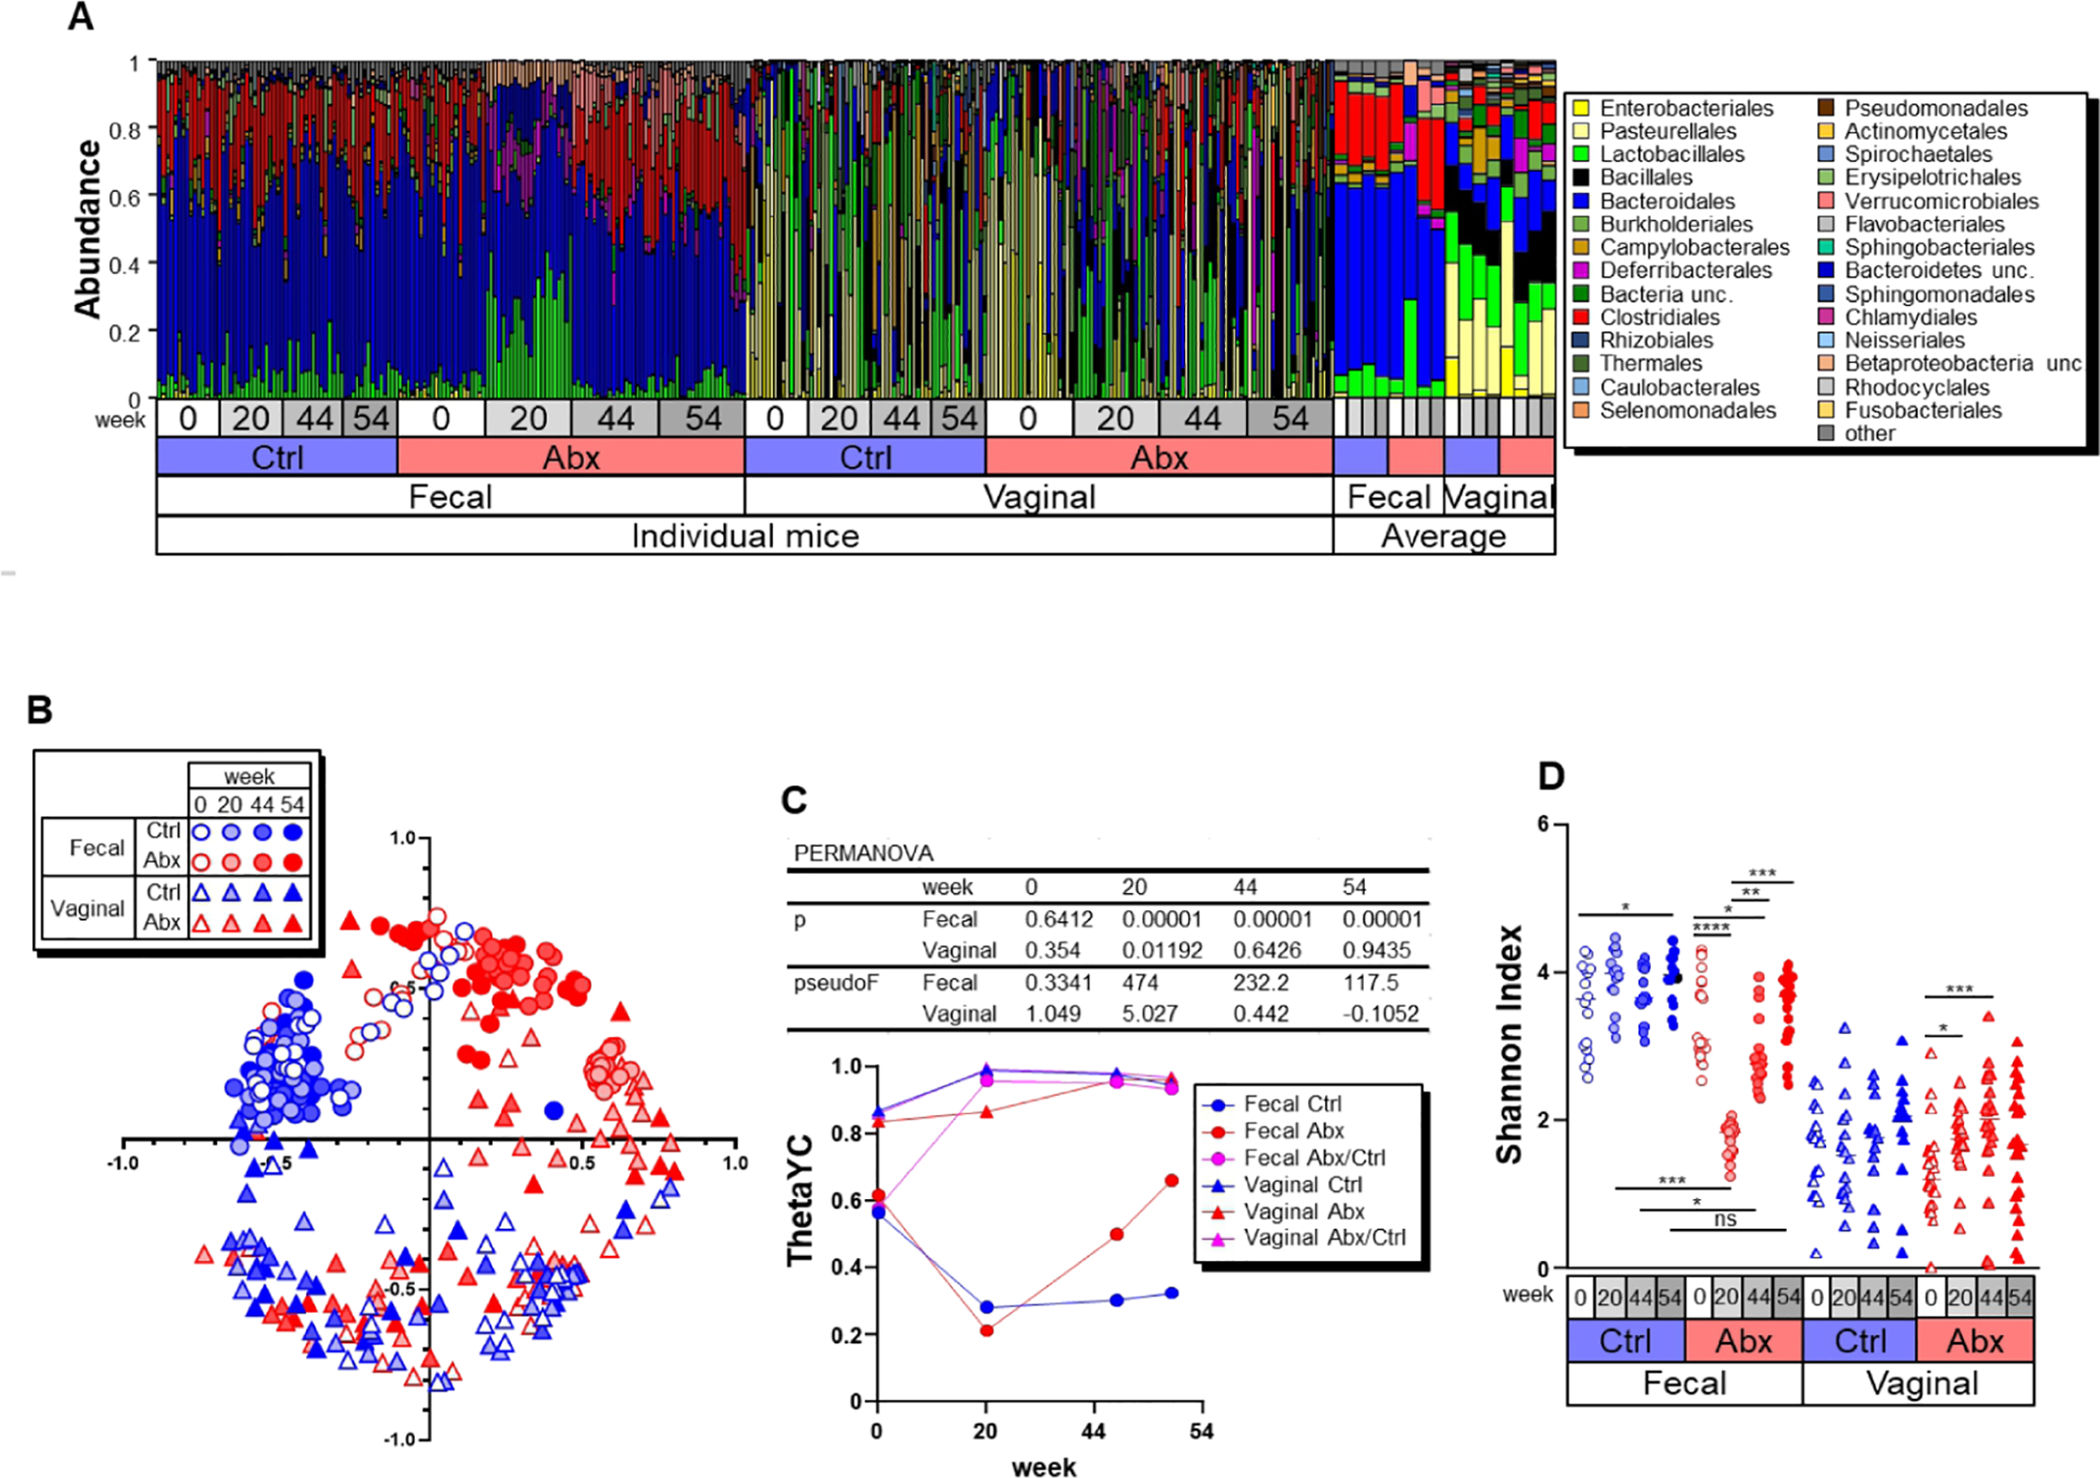
Figure 2. Antibiotic treatment induces irreversible transition of the fecal and vaginal microbiota composition.

A) Relative abundance of dominant bacterial orders in feces and vaginal lavage from BPRN mice. B) NMDS plot of β-diversity values (θYC indexes) of microbiota in feces (circles) and vaginal lavage (triangles) from BPRN mice is shown with the minimal stress after 100 iterations. C) β diversity at indicated time points in samples from control and Abx BPRN mice. Data are expressed as the median. The p and pseudoF values of PERMANOVA are shown between control and Abx groups in the upper portion of the panel. D) α diversity (Shannon diversity index) of fecal and vaginal microbiotas of Abx and control BPRN mice. Data from individual mice are shown, along with median lines. *, p < 0.05; **, p<0.01; ***, p < 0.005; ****, p<0.001 (one-way ANOVA followed by Friedman and Dunnett’s tests for kinetic and intragroup comparisons, respectively).
