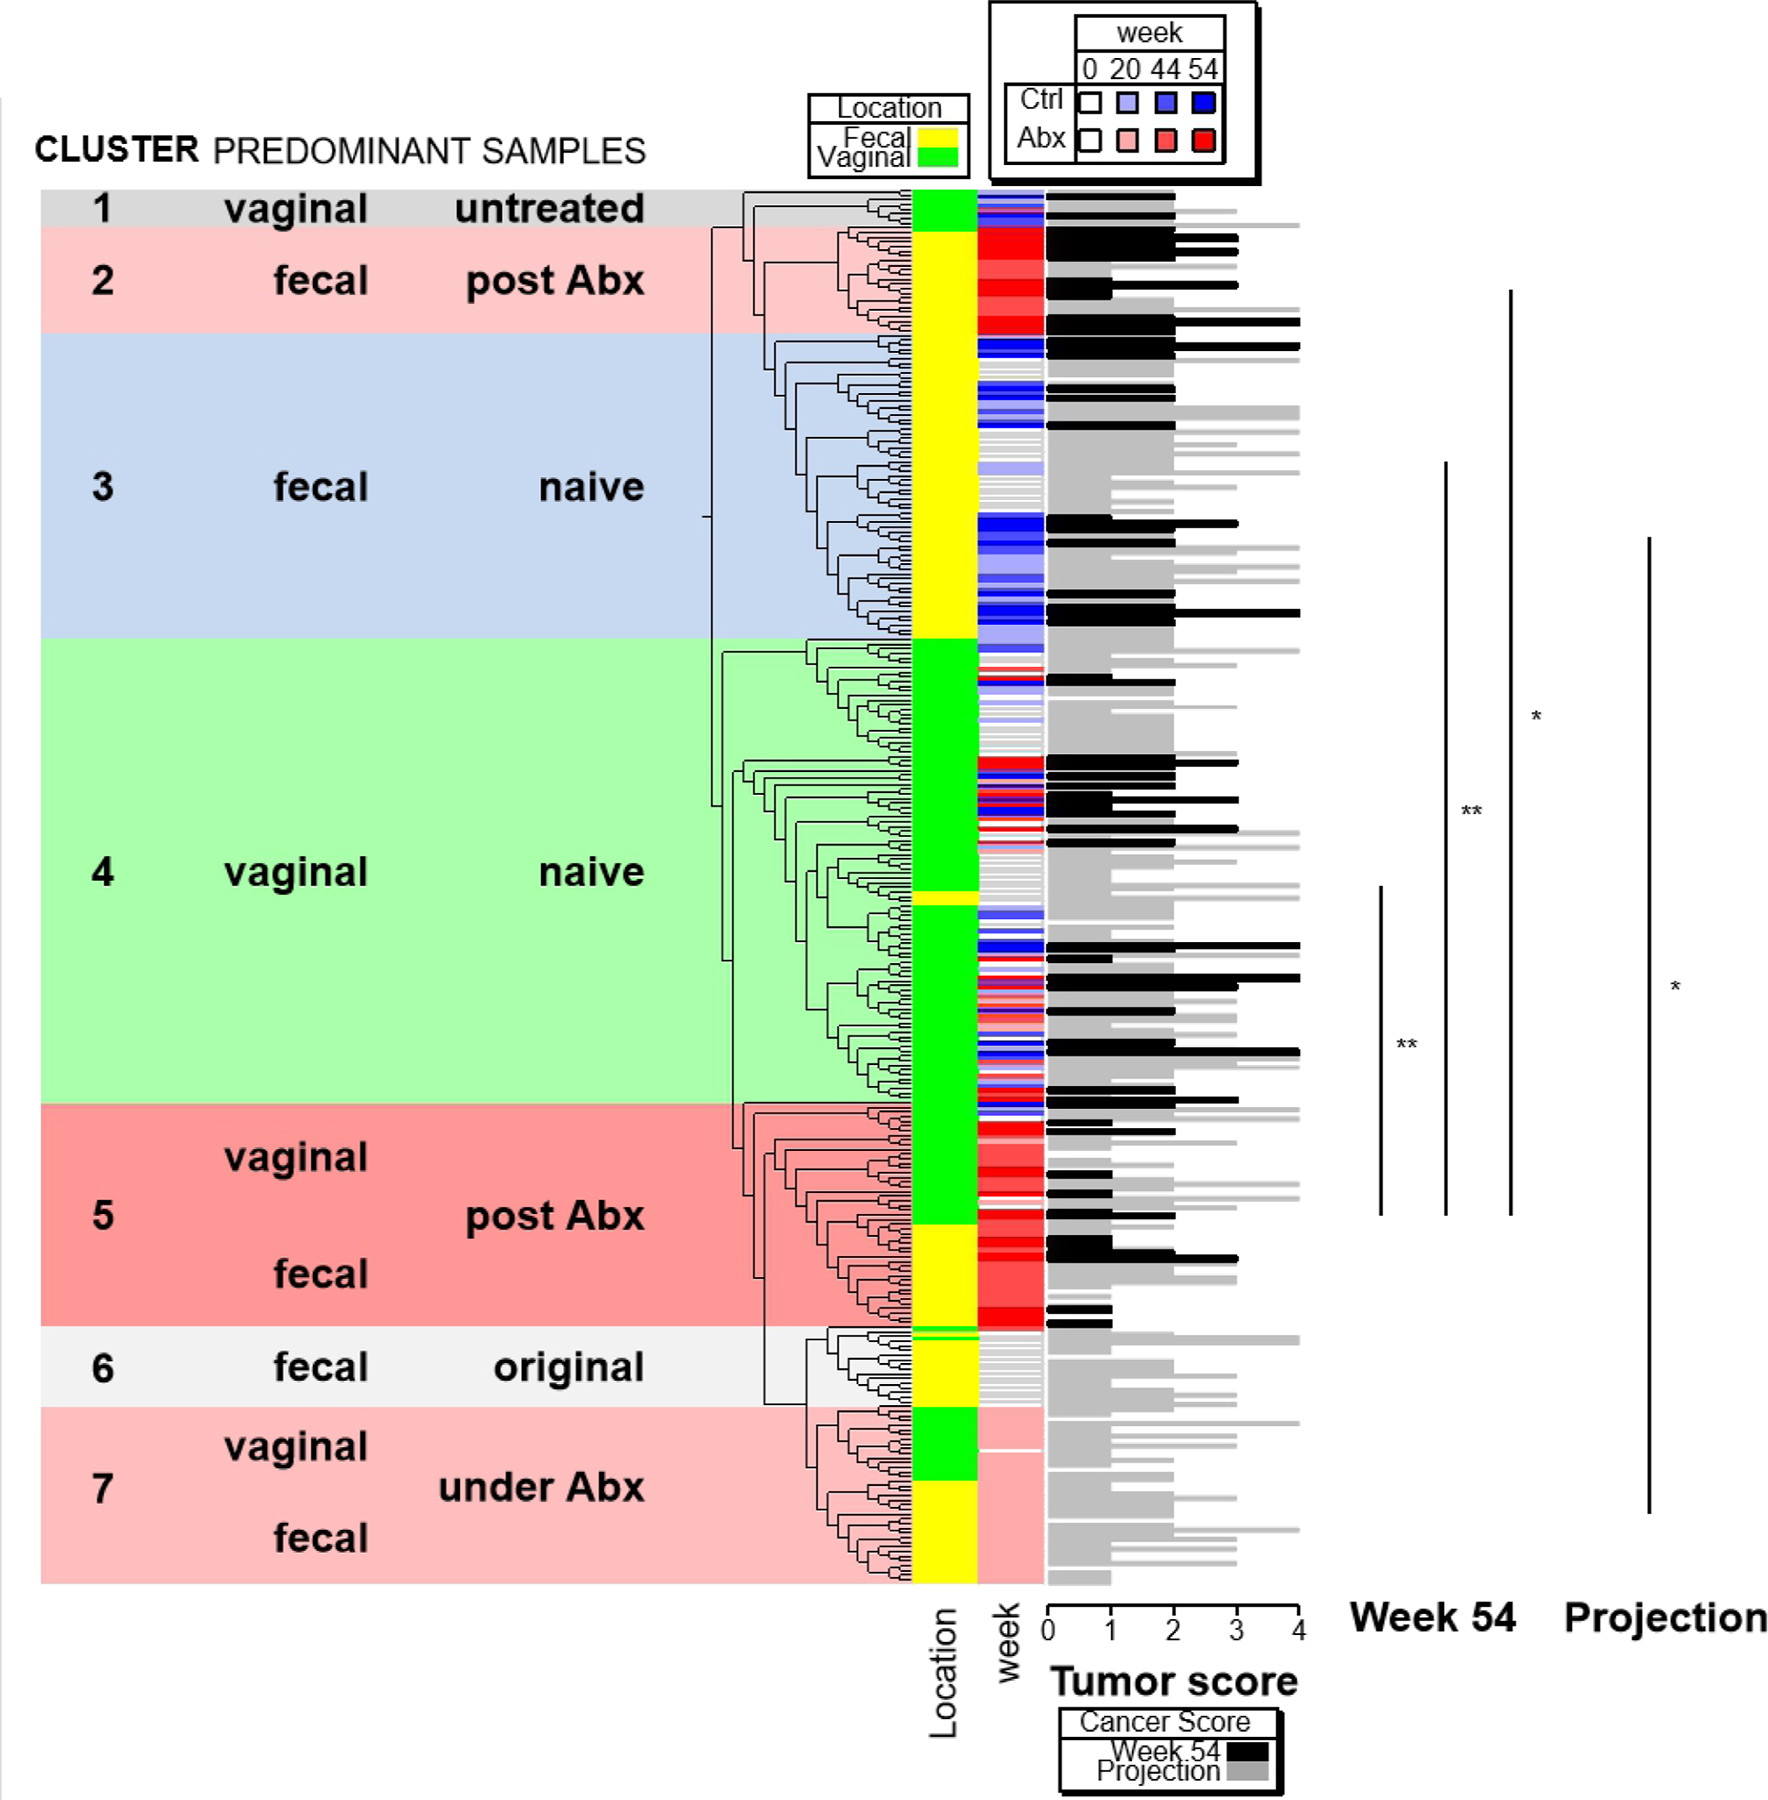
Figure 3. Differences in microbiota composition after antibiotic treatment are associated with oviductal HGSC development.

All individual samples from mice that survived until the experimental end point (wk 54) were hierarchically clustered by using logarithmic abundance values of OTUs with maximal abundance cut < 1%. The samples were assigned to seven clusters by type of sample (fecal vs vaginal), type of treatment (control vs Abx) and time point of sampling. Tumor scores of samples at week 54 are shown as black bars, and “projection” tumor scores for samples obtained earlier than 54 wk are shown as grey bars. The difference in tumor scores between specific pairs of clusters are shown at right. *, p < 0.05; **, p<0.01 (one-way ANOVA followed by Dunnett’s tests).
