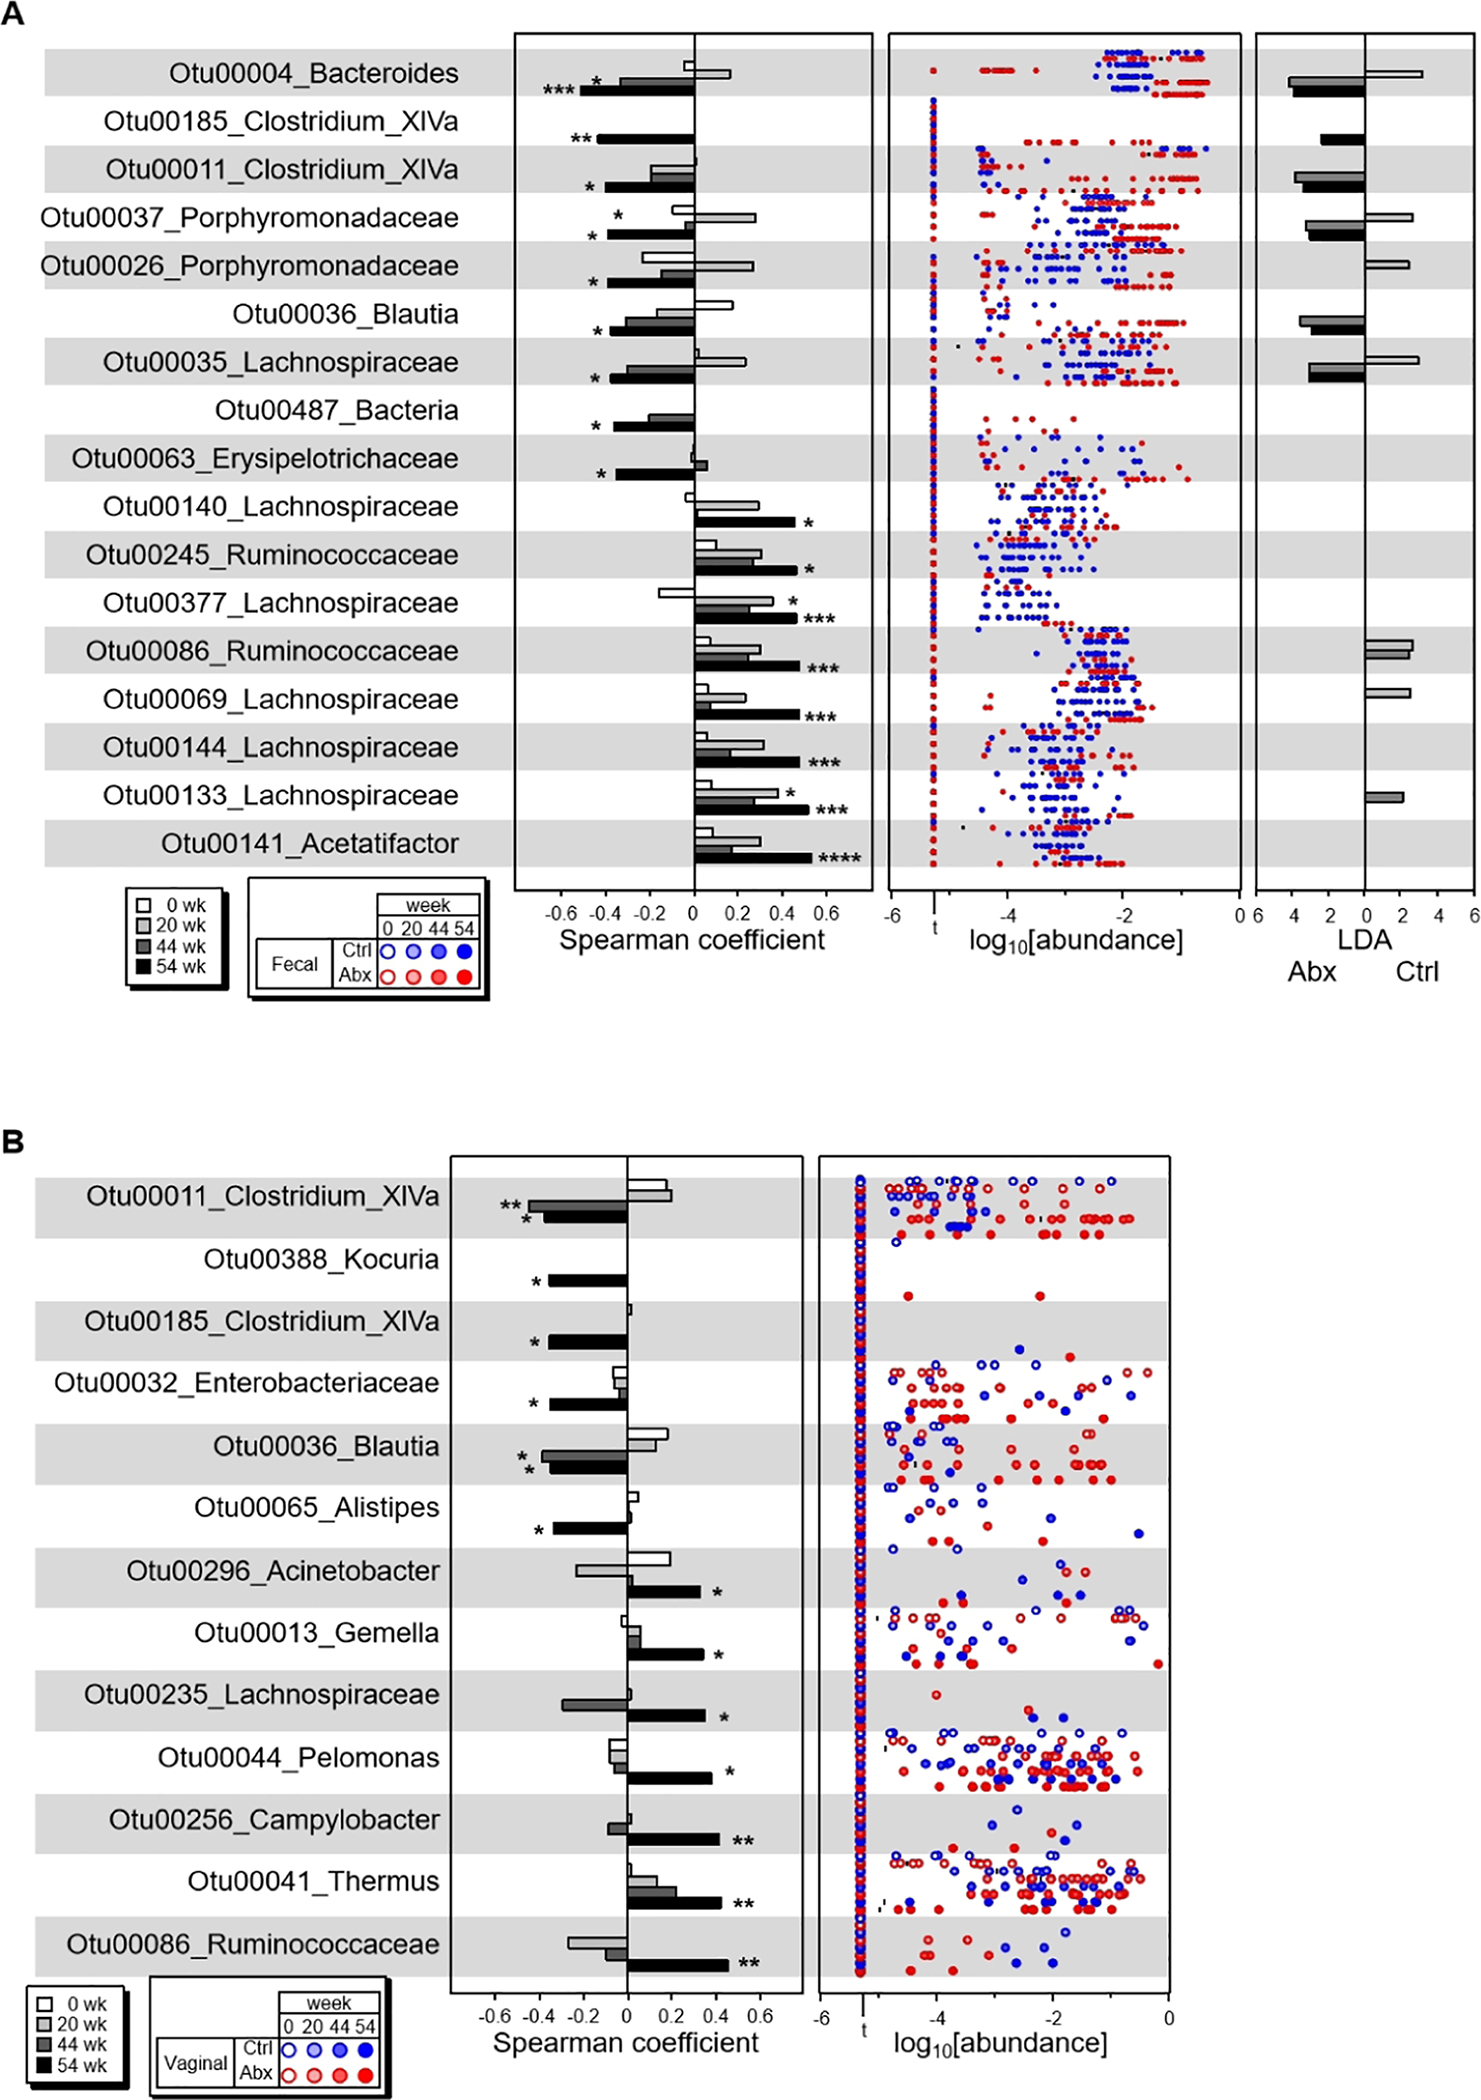
Figure 4. Specific bacteria are associated with ovarian tumor development.

The OTUs whose abundances were highly associated with tumor scores at the end point (wk 54) were screened by Spearman Ranking coefficient. A) All negatively associated and top 8 of 56 positively associated OTUs in fecal microbiota are shown with Spearman Ranking coefficients at wk 54 and early time points with p values below 0.05 (left panel), OTU abundances at indicated weeks (center panel), and LDA values of LEfSe (p<0.05, FDR q<0.05) between Abx-treated and control mice (right panel). B) All negatively associated and positively associated OTUs in vaginal microbiota are shown with Spearman Ranking coefficients at wk 54 and early time points with p value cut 0.05 (left panel) and OTU abundances at indicated weeks (right panel). For vaginal microbiota, no significant difference of indicated OTUs was detected between Abx-treated and control mice with LEfSe p<0.05 and FDR q<0.05. *, p < 0.05; **, p<0.01; ***, p < 0.005; ****, p<0.001. All Spearman coefficient data of fecal bacteria that are positively associated with tumor scores were available in Figure S4A. All bacteria that showed statistically different abundances in Abx-treated and control with LEfSe p<0.05 and FDR q<0.05 are shown in Figures S4E and S4F.
