Fig. 1.

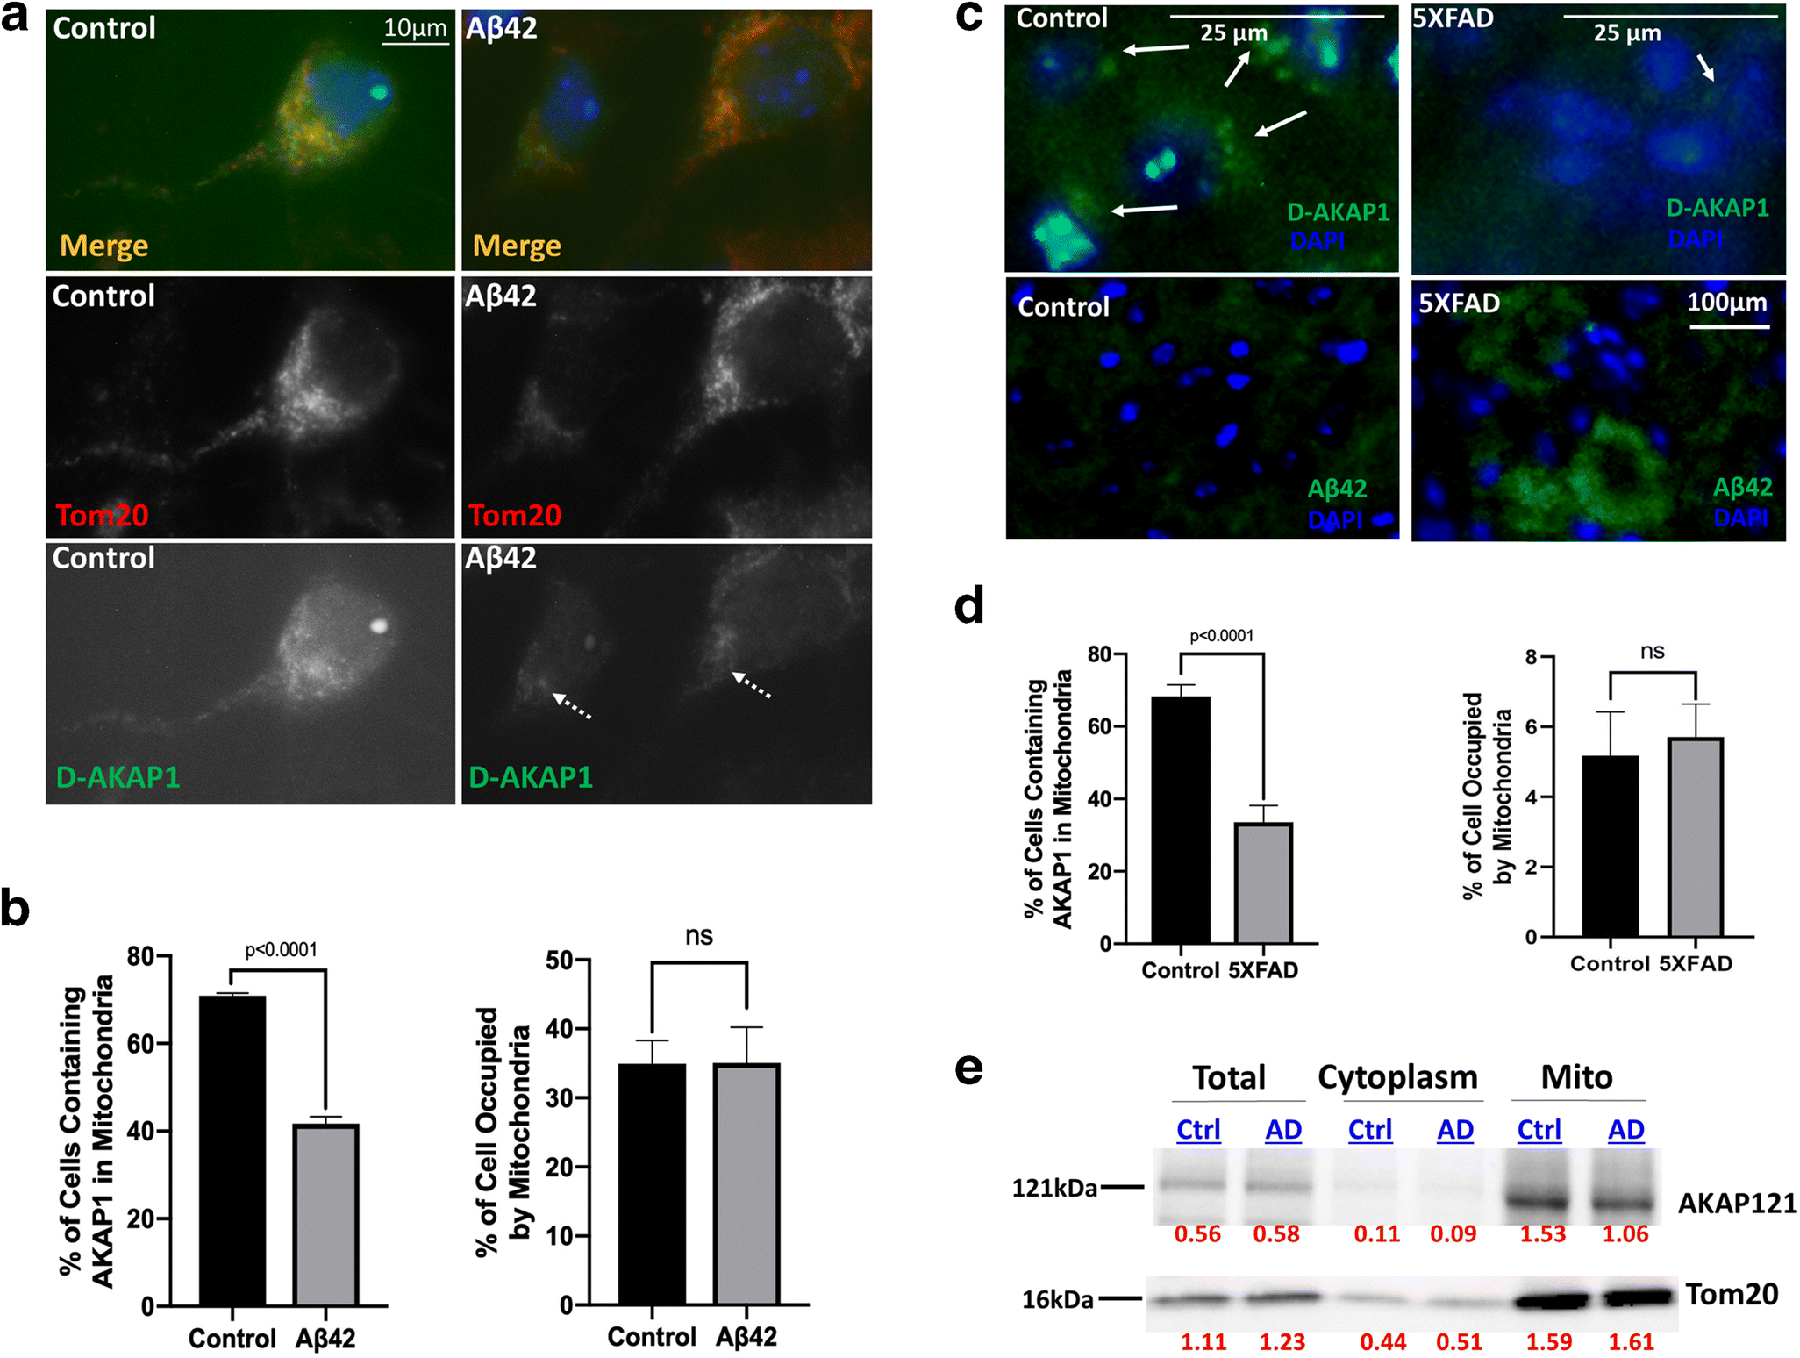
The level of endogenous D-AKAP121 is significantly decreased in mitochondria of neurons in in vitro and in vivo models of Alzheimer’s disease.
(a) Representative epifluorescence micrographs (60X) showing decreased levels of D-AKAP1 (green channel), but not of mitochondria (TOM20, red channel), in primary cortical neurons treated with a 24 hr. dose of beta amyloid (10μM) compared to untreated primary neurons (control). White arrows point to the location of immunoreactive clusters of D-AKAP1 that colocalize with mitochondria. (b) Left: representative bar graph showing a compiled quantification of the percentage of cells containing D-AKAP1 in mitochondria of primary cortical neurons treated with vehicle control or with Aβ42. The right bar graph shows a compiled quantification of the percentage of the soma occupied by mitochondria, as identified by immunostaining with TOM20, as a metric of mitochondrial content. For both graphs, means ± SEM, derived from 250–300 primary cortical neurons from at least 10 epifluorescence microscopic fields per experiment compiled from three independent experiments (*:p<0.05 vs. control, Welch’s t-test). (c) Representative epifluorescence micrographs (60X) showing a decrease in the number of neurons that immunostained with D-AKAP1 (top two panels) in hippocampal slices derived from 5X-FAD (top right and lower right panel) compared to control non-transgenic mice (top left and lower left panels). Pathological events coincide with an accumulation of Aβ42 in neurons. White arrows point to neurons that express D-AKAP1 (green channel). (d) Left: representative bar graph showing a compiled quantification of the percentage of cells that contained D-AKAP1 in mitochondria of immunostained hippocampal neurons from hippocampal slices derived from 6-month-old non-transgenic control or 5X-FAD mice. The right bar graph shows a compiled quantification of the percentage of the soma occupied by mitochondria, as identified by immunostaining with TOM20, as a metric of mitochondrial content in hippocampal neurons from hippocampal slices derived from 6.6-month-old non-transgenic control or 5X-FAD mice. For both graphs, means ± SEM, derived from 4–6 brain slices from 3–4 animals per genotype (*:p<0.05 vs. control, Welch’s t-test). (e) Representative Western blot of endogenous D-AKAP1 and of TOM20 from brain lysates, and of cytosolic and mitochondrial fractions derived from 6.5 month old control non-transgenic (Ctrl) or 5X-FAD (AD) mice. Densitometric quantification of D-AKAP1-immunoreactive bands, normalized to TOM20, is shown on the bottom of the blot (red numbers). The data show that the level of endogenous D-AKAP1 is decreased in mitochondria of 5X-FAD mice (~27% decrease) compared to non-transgenic control mice. The data show that D-AKAP1 levels are decreased in mitochondria of 5X-FAD mice (~27% decrease) compared to non-transgenic control mice. Although the AKAP121 immunoreactive bands ran at the expected molecular weight (~121kDa), please note that a slight electrophoretic shift occurred in the mitochondrial fractions relative to the corresponding cell lysates, presumably due to the different buffers that were used during the isolation of mitochondria vs. cell lysates, which may have caused the mitochondrial fraction bands to migrate modestly faster.
