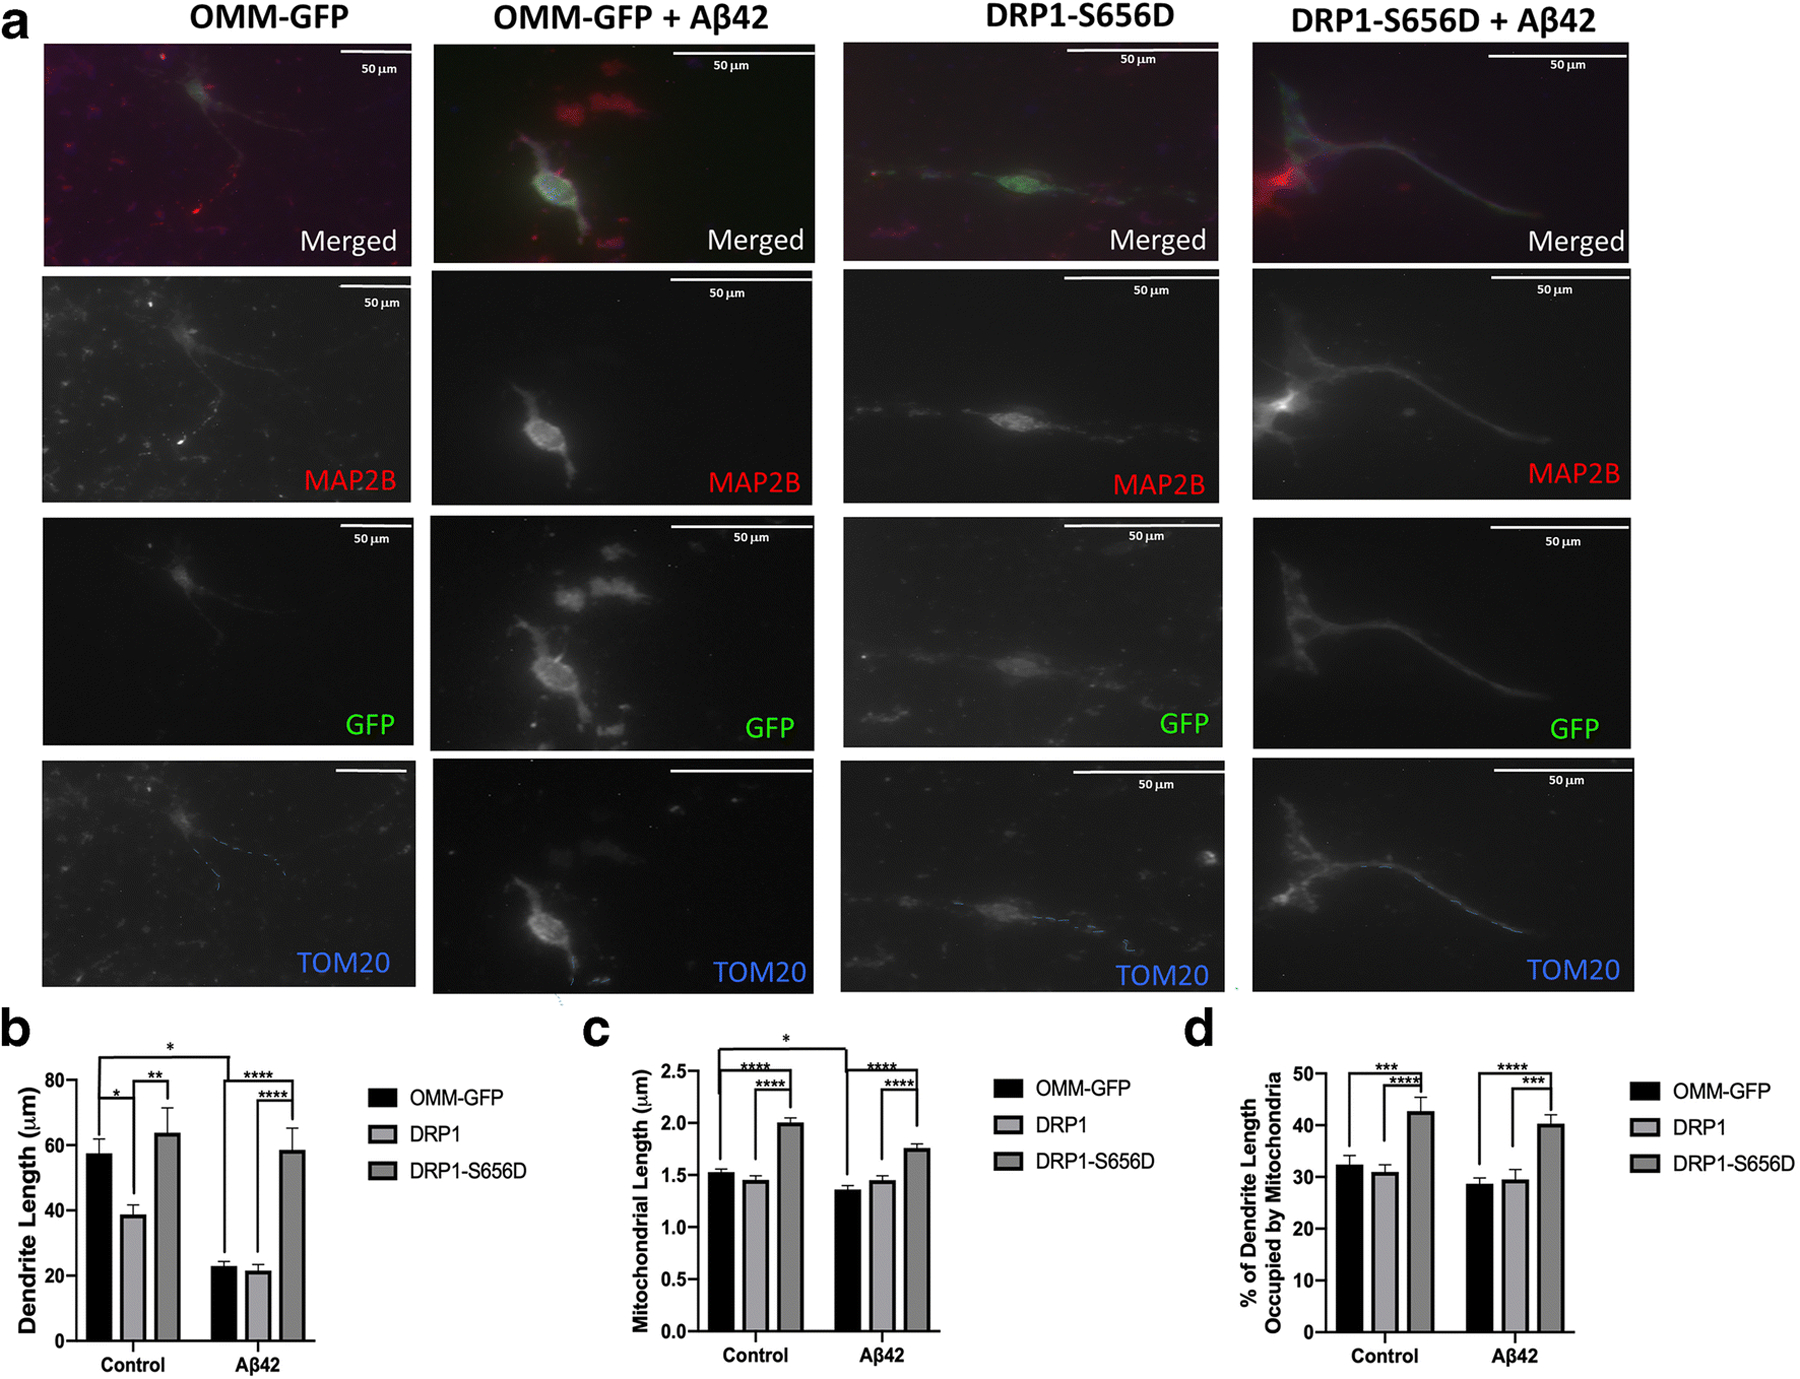
Fig. 3.

D-AKAP1/PKA protects dendrites and mitochondrial structure from Aβ42-mediated toxicity via PKA-mediated phosphorylation of Drp1.
(a) Representative epifluorescence micrographs (60X) of primary cortical neurons expressing the indicated GFP-tagged DRP1-modulating plasmids in the presence of vehicle control (DMSO) or Aβ42. Primary neurons were immunostained for MAP2B (red) to identify dendrites, for GFP (green) to identify transfected neurons, and for TOM20 (blue) to identify mitochondria. Mitochondria inside MAP2-positive dendrites are indicated by blue dashes. Transient expression of PKA phosphomimetic mutant of Drp1 (S656D) protects dendrites and the number of dendritic mitochondria from Aβ42-treatment compared to primary neurons expressing OMM-GFP as a control. (b) Bar graph shows a compiled quantification of the mean dendrite length per neuron, as measured in MAP2B-positive neurites in primary cortical neurons treated with vehicle or with Aβ42 (24 hr., 10μM). Means ± SEM, derived from 250–300 primary cortical neurons from at least 10 epifluorescence microscopic fields per experiment, were compiled from three independent experiments (**/***:p<0.01 vs. OMM-GFP or DRP1-S656D/Aβ42 in each series, *:<0.05 vs. OMM-GFP/Aβ4,, Two-Way ANOVA with Tukey’s post hoc test). (c) Bar graph shows a compiled quantification of the mean mitochondrial length of dendritic mitochondria, as identified by immunostaining with TOM20 within MAP2B-positive neurites, and quantified by Image J in primary cortical neurons treated with vehicle or with Aβ42(24 hr., 10μM). Means ± SEM, derived from 250–300 primary cortical neurons from at least 10 epifluorescence microscopic fields per experiment, were compiled from three independent experiments (**/***:p<0.01 vs. OMM-GFP or for DRP1-S656D/Aβ42for each series, Two-Way ANOVA with Tukey’s post hoc test). (d) Bar graph shows a compiled quantification of the mean mitochondrial content in dendrites (% of dendrite length occupied by mitochondria), as identified by immunostaining with TOM20 within MAP2B-positive neurites, and quantified by Image J in primary cortical neurons treated with vehicle or with Aβ42 (24 hr., 10μM). Means ± SEM, derived from 250–300 primary cortical neurons from at least 10 epifluorescence microscopic fields per experiment, were compiled from three independent experiments (Two-Way ANOVA with Tukey’s post hoc test).
