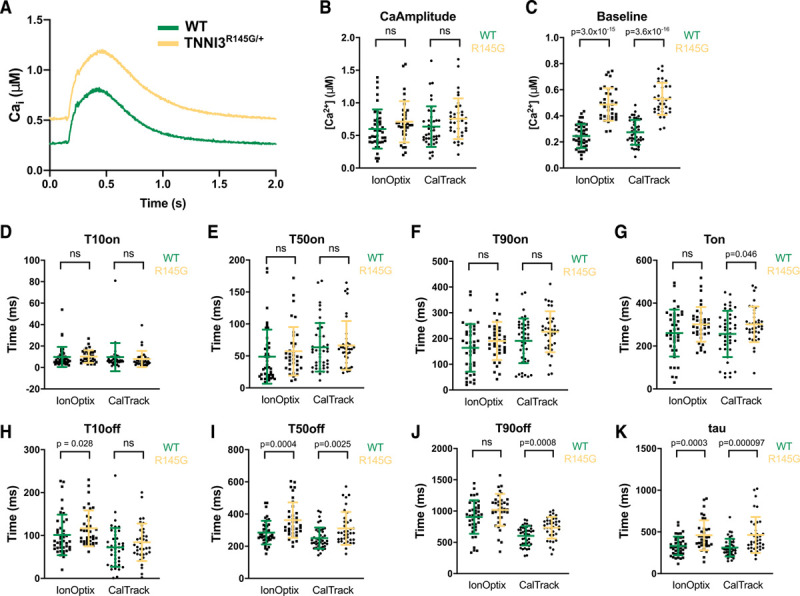
Figure 5.

Automated CalTrack quantification of calcium concentration and kinetic parameters in guinea pig wild-type (WT) and TnnI3R145G/+ cardiomyocytes is comparable to manual IonOptix IonWizard software analysis. A, Average calcium transients are identical by analysis via IonWizard or CalTrack analysis. Average traces are made of n=42 WT and n=36 for TnnI3R145G/+ cells. B, Calcium amplitude is unaffected by Tnni3R145G/+. C, Baseline [Ca2+] is increased in TnnI3R145G/+ cells. Time to 10% of peak (T10on; D), time to 50% of calcium peak (T50on; E), and time to 90% of peak (T90on; F) are unaffected by TnnI3R145G/+. G, time to reach calcium peak (Ton) is significantly longer in TnnI3R145G/+ cardiomyocytes when assessed by CalTrack analysis. H, Time of 10% decay (T10off) is unaffected by TnnI3R145G/+. I, Time of 50% calcium decay (T50off) is longer in TnnI3R145G/+ cardiomyocytes. J, Time of 90% decay (T90off) is assessed to be longer in TnnI3R145G/+ cardiomyocytes by CalTrack analysis. K, Calcium decay constant (Tau) is significantly longer in TnnI3R145G/+ cardiomyocytes. Statistical analysis is performed by a 2-tailed Student t test (Baseline, Ton, T90on, and T90off) or by nonparametric Mann-Whitney test (CaAmplitude, T10on, T50on, T10off, T50off, tau) with a significance cutoff of P<0.05. No statistical comparisons are made between IonOptix and CalTrack. Ns indicates nonsignificance.
