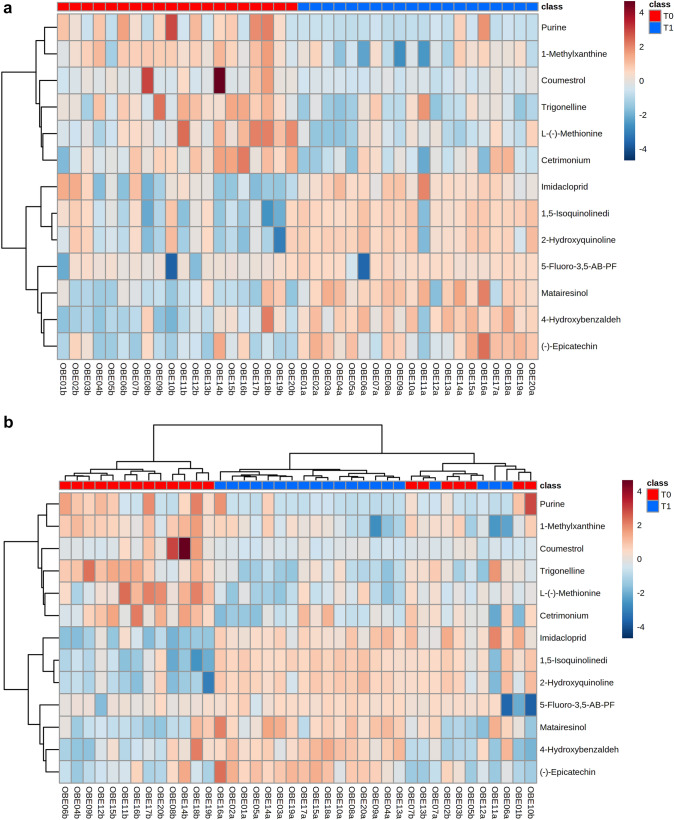
Fig. 1.
A Reorganized and B not reorganized hierarchical clustering and heatmaps of the 13 metabolites that were different in their peak intensity before and after weight reduction. Ordered columns represent the fecal metabolite profile for each dog before (T0) and after a period of weight reduction (T1) using a therapeutic diet and sorted by group. Colored bars on the x-axis represent group of dogs (red, obese dogs before weight loss; blue, obese dogs after weight loss). Rows represent the 13 metabolites that differed, highlighting two clusters of metabolites: the first comprised metabolites that decreased after weight reduction (i.e., purine, 1-methylxanthine, coumestrol, trigonelline, L-(-)-methionine, and cetrimonium); the second comprised metabolites that increased after weight reduction (i.e., imidacloprid, 1,5-isoquinolinediol, 2-hydroxiquinoline, 5-fluoro-3,5-AB-PFUPPYCA, matairesinol, 4-hydroxybenzaldehido, and (-)-epicatechin)

