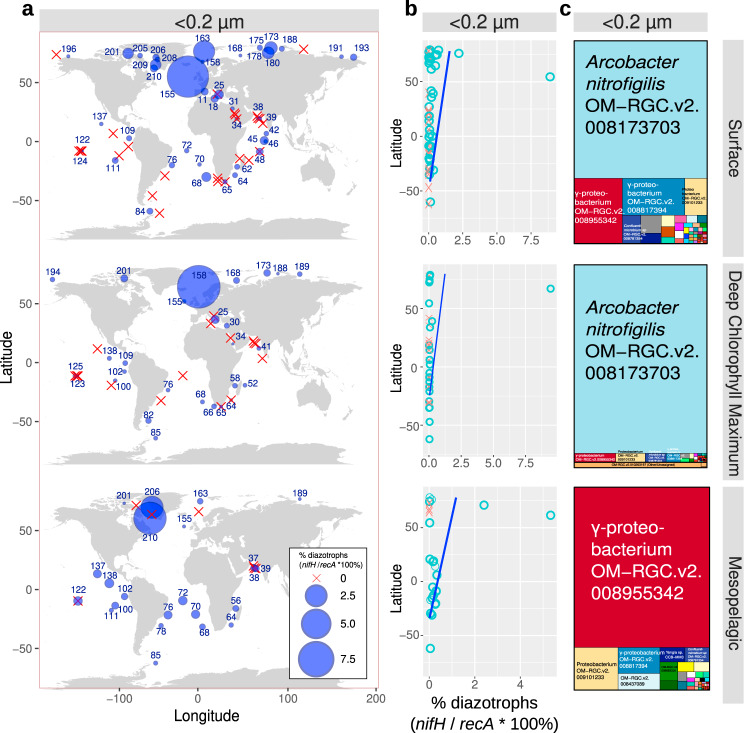
Fig. 10. Detection of ultrasmall diazotrophs in metagenomes obtained from <0.22 µm size-fractionated samples of different water layers.
The percentage of diazotrophs among ultrasmall bacterioplankton was estimated by the ratio of metagenomic read abundance between the marker genes nifH and recA. a Biogeography. The bubble size varies according to the percentage of diazotrophs, while red crosses indicate absence (i.e., no detection of nifH reads). Station labels with diazotrophs detection are indicated in blue. b Latitudinal abundance gradient. Circles correspond to samples with diazotrophs, while crosses indicate absence. The blue lines correspond to generalized additive model smoothings. c Taxonomic distribution of the nifH reads. The ‘OM-RGC.v2’ prefix indicates the nifH sequences assembled from metagenomes of <3 μm size fractions22, including <0.22 μm. Source data are provided as a Source data file.

