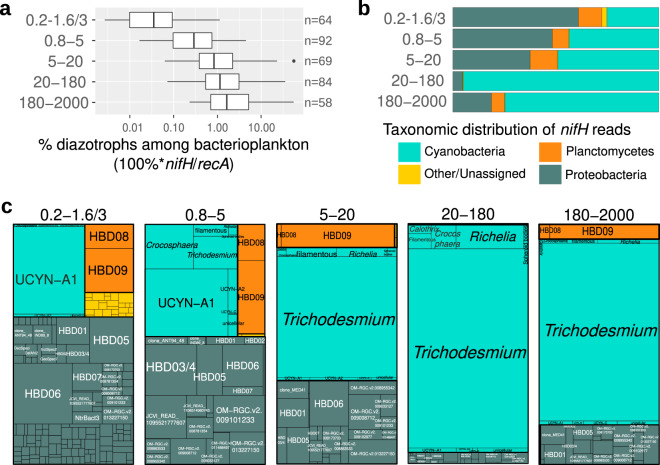
Fig. 5. Abundance of diazotrophs in surface waters using metagenomes obtained from different size-fractionated samples.
a Diazotroph abundance. The percentage of diazotrophs in the bacterioplankton community was estimated by the ratio of metagenomic read abundance between the marker genes nifH and recA. b Taxonomic distribution of the nifH reads. c Taxonomic distribution at deeper resolution. HBD01 to HBD09 (heterotrophic bacterial diazotrophs) corresponds to the metagenome-assembled genomes from <3-µm size fractions16. Boxplots depict the 25–75% quantile range of the dataset without zeros (the corresponding biologically independent seawater samples are indicated in the plot), with the center line depicting the median (50% quantile); whiskers encompass data points within 1.5× the interquartile range. Source data are provided as a Source data file.

