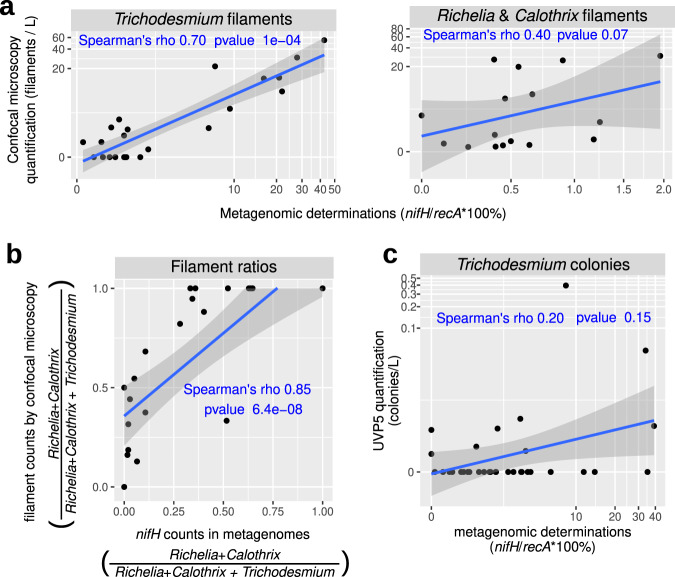
Fig. 6. Correlation analysis between diazotroph quantifications by imaging and molecular methods.
a, b Comparison between environmental high content fluorescence microscopy (eHCFM30) and metagenomics. Calothrix, Richelia, and Trichodesmium in samples from size fraction 20–180 μm were measured by quantification of high-throughput confocal microscopy images (filaments L−1) and by metagenomic counts (% of diazotrophs in the bacterioplankton community by the ratio between the marker genes nifH and recA). a Correlation of relative abundances in metagenomes and absolute abundances by confocal microscopy for the three taxa. b Correlation between the ratio of abundances between taxa. c Comparison between Underwater Vision Profiler 5 (UVP533) and metagenomics. Trichodesmium colonies were measured by UVP5 quantification (colonies L−1) and by metagenomic counts in the 180–2000 µm size-fractionated samples. Spearman’s rho correlation coefficients and uncorrected one-side p-values are displayed in blue. Source data are provided as a Source data file.

