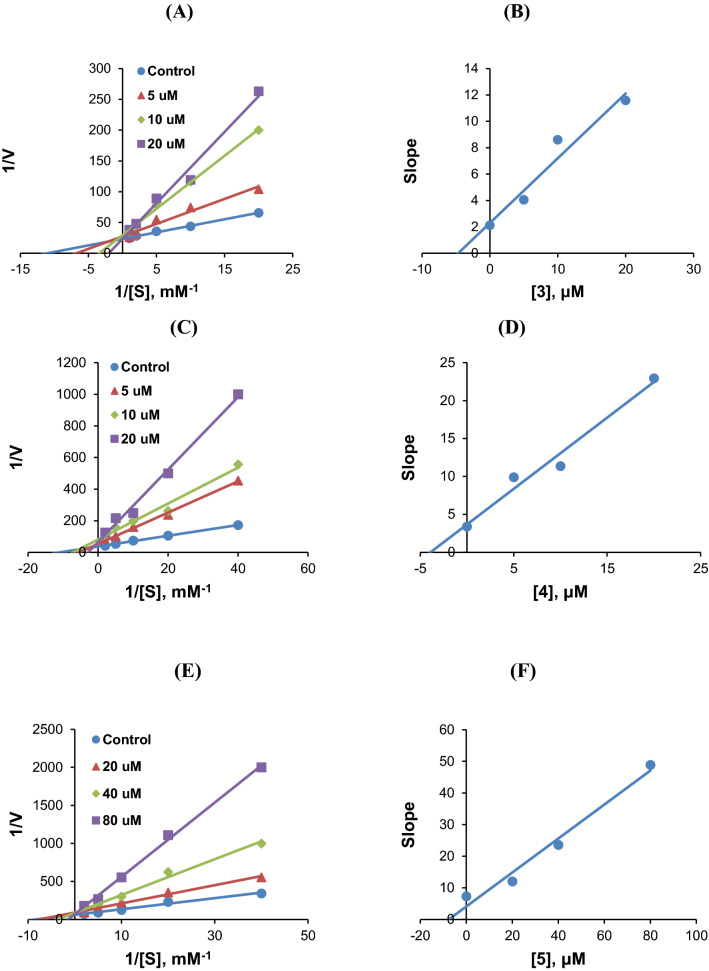
Figure 4.
Lineweaver–Burk (LB) plots of AChE inhibitions by 3, 4, and 5 (A, C, and E, respectively), and their respective secondary plots (B, D, and F, respectively) of the slopes of LB plots versus inhibitor concentrations. Substrate concentrations ranged from 0.05 to 1.0 mM. Experiments were carried out at three inhibitor concentrations, i.e., at ~ 0.5 × , 1.0 × , and 2.0 × IC50 values. Initial reaction rates are expressed as increases in absorbance per min.

