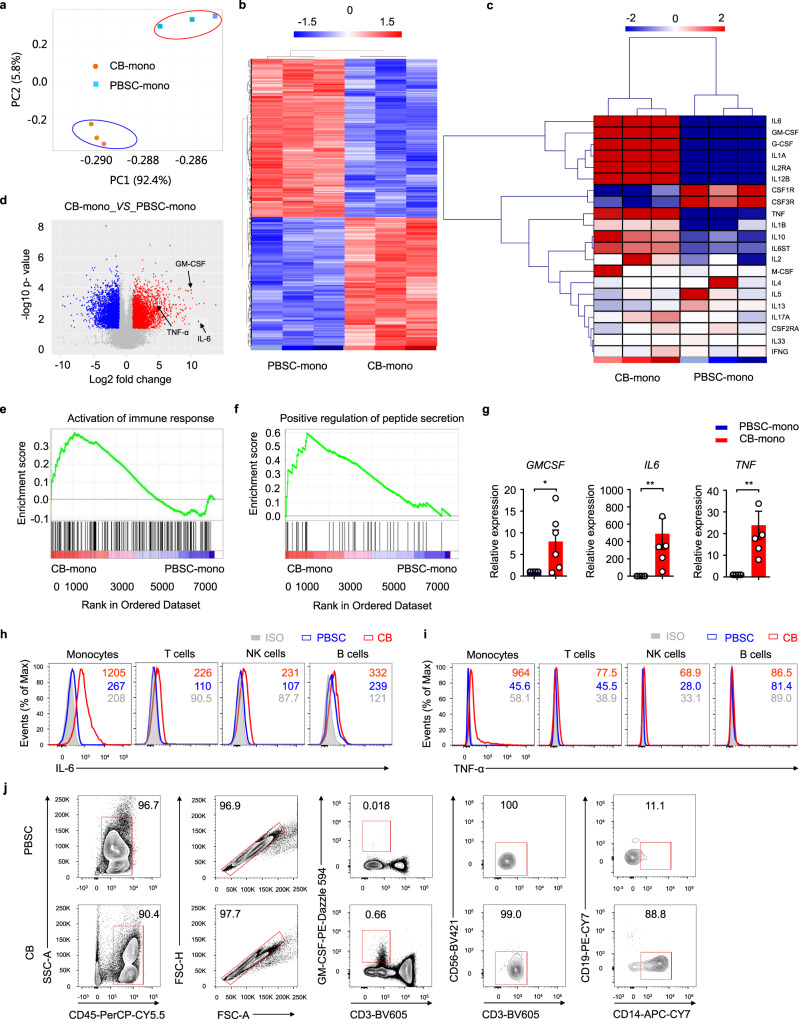
Fig. 3. Inflammatory characteristics of monocytes derived from umbilical cord blood.
a Principal component analysis of monocytes derived from CB (CB-mono) and PBSC (PBSC-mono). Red, CB-mono; blue, PBSC-mono. Each point represents a biologically independent sample. b Heat map representation of differentially-expressed genes (fold change >2, adjusted P < 0.05) between CB-mono and PBSC-mono. Each column represents an individual biological replicate. c Heat map representation of the expression of key proinflammatory and regulatory genes in CB-mono and PBSC-mono. Each column represents an individual biological replicate. d Comparison of microarray expression values in CB-mono and PBSC-mono. e GSEA plots showing that the activation of immune-response genes was upregulated in CB-mono. f GSEA plots showing that positive regulation of peptide-secretion genes was upregulated in CB-mono. g GM-CSF, IL-6, and TNF-α expression in CB-mono or PBSC-mono (p = 0.0476, 0.0022, and 0.0022, respectively), as assessed by RT-PCR. Data are representative of six experiments. Mann–Whitney test (two-sided). h Representative histograms of intracellular IL-6 in monocytes, T cells, NK cells, and B cells from peripheral blood stem cells or cord blood; n = 16 for peripheral blood stem cells; n = 17 for cord blood. i Representative histograms of intracellular TNF-α in monocytes, T cells, NK cells, and B cells from peripheral blood stem cells or cord blood; n = 12 for peripheral blood stem cells; n = 15 for cord blood. j Flow cytometry gating strategy utilized to identify GM-CSF+ cells; PBSC, n = 6; CB, n = 12. The numbers in (h) and (i) show the mean fluorescence intensity (MFI) of IL-6 and TNF-α expression, respectively. Data in (g) are presented as means ± standard error of the mean (SEM). *p < 0.05, **p < 0.01. Source data are provided as a Source Data file.

