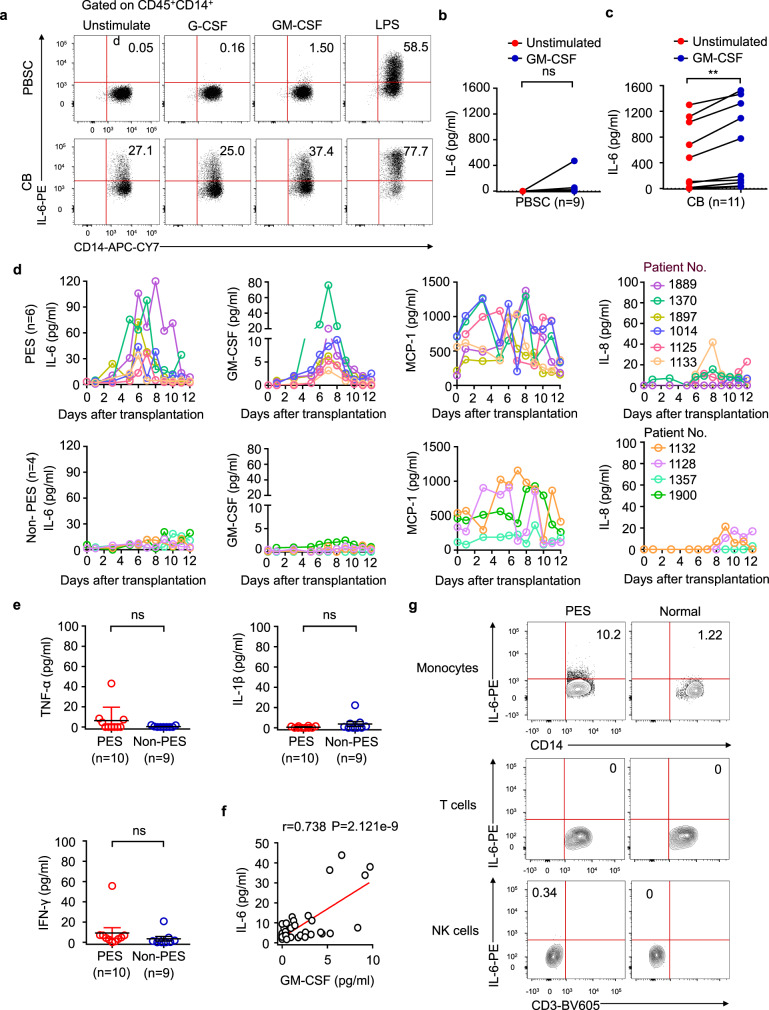
Fig. 4. IL-6 production in patients with PES.
a Frequency of IL-6-producing CD14+ monocytes within the CD45+ population from peripheral blood stem cells or cord blood mononuclear cells during a 6-h culture period. Representative plots are shown from a total of nine independent experiments. b, c ELISA of IL-6 in supernatants from PBSC or CB during a 6-h culture period. PBSC, n = 9, CB, n = 11. Paired t test (two-sided). d Dynamic changes in the plasma cytokine levels of patients with PES or without PES (PES, n = 6; Non-PES, n = 4). e Plasma cytokine levels in patients with or without PES. PES, n = 10; Non-PES, n = 9. Mann–Whitney test (two-sided). f Linear regression analysis of the association between the concentration of GM-CSF and IL-6 (p = 2.121e-9, R = 0.738, by using a two-sided Pearson correlation coefficient). g Frequencies of IL-6-producing monocytes, T cells, and NK cells within the CD45+ populations from peripheral blood in patients with PES or healthy donors, n = 3. In order to compare means (PES vs. Non-PES), Mann-Whitney test (two-sided) was used in (d). Data are shown as means ± standard error of the mean (SEM). n.s., not significant, **p < 0.01. Source data are provided as a Source Data file.

