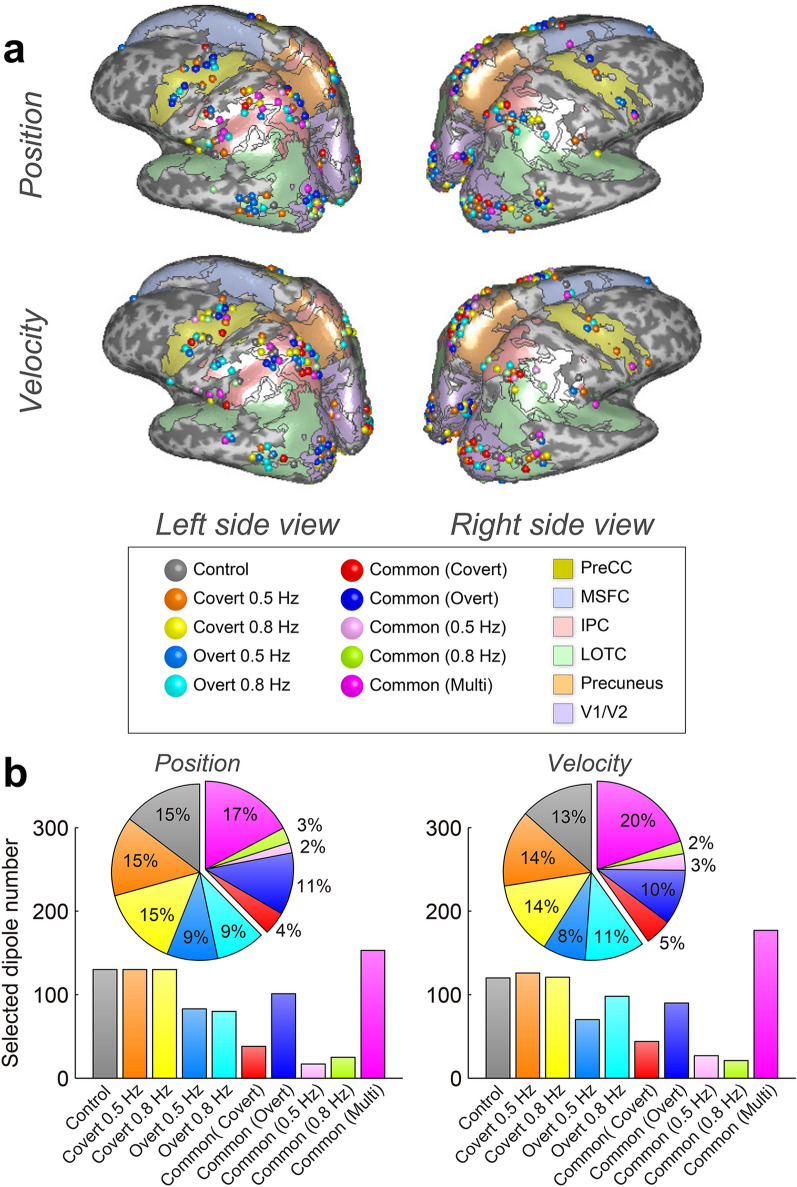
Figure 6.
(a) SLiR–selected dipole locations on inflated cortical surface maps. (b) Rate of selected dipole numbers for tasks. The exclusively selected dipoles for control, covert 0.5 Hz, covert 0.8 Hz, overt 0.5 Hz, and overt 0.8 Hz are shown in gray, orange, yellow, blue, and cyan, respectively. The commonly selected dipoles for covert (0.5 and 0.8 Hz), overt (0.5 and 0.8 Hz), 0.5 Hz (covert and overt), and 0.8 Hz (covert and overt) are shown in red, blue-purple, pink, and green, respectively. The commonly selected dipoles by more than three tasks are shown in magenta. The same color format is used in pie charts and bar graphs in (b). Numbers of cortical dipole currents were 1987.17 ± 2057.03 (participant mean ± SD), and these dipole currents were used for SLiR inputs as explanatory variables. Input dimensions of control, covert 0.5 Hz, covert 0.8 Hz, overt 0.5 Hz, and overt 0.8 Hz were reduced to 55.17 ± 15.15, 62.47 ± 18.77, 55.53 ± 18.54, 64.50 ± 19.79, and 68.57 ± 20.15 [position] and 56.90 ± 16.67, 64.93 ± 17.79, 56.50 ± 14.44, 61.07 ± 25.72, and 69.07 ± 19.02 [velocity]. Cortical regions of PreCC, MSFC, LOTC, IPC, precuneus, and V1/V2 had current dipole numbers of 141.33 ± 127.20, 59.33 ± 64.35, 335.50 ± 364.52, 314.83 ± 283.26, 26.50 ± 34.80, and 529.50 ± 583.36, respectively. SLiR sparseness narrowed input dimensions to [position]: 4.83 ± 1.60, 2.50 ± 3.99, 7.00 ± 4.34, 10.50 ± 7.12, 0.67 ± 0.82, and 16.33 ± 10.80, [velocity]: 6.33 ± 3.22, 3.33 ± 4.80, 8.33 ± 7.55, 9.83 ± 6.91, 0.33 ± 0.52, and 13.17 ± 7.22, respectively.

