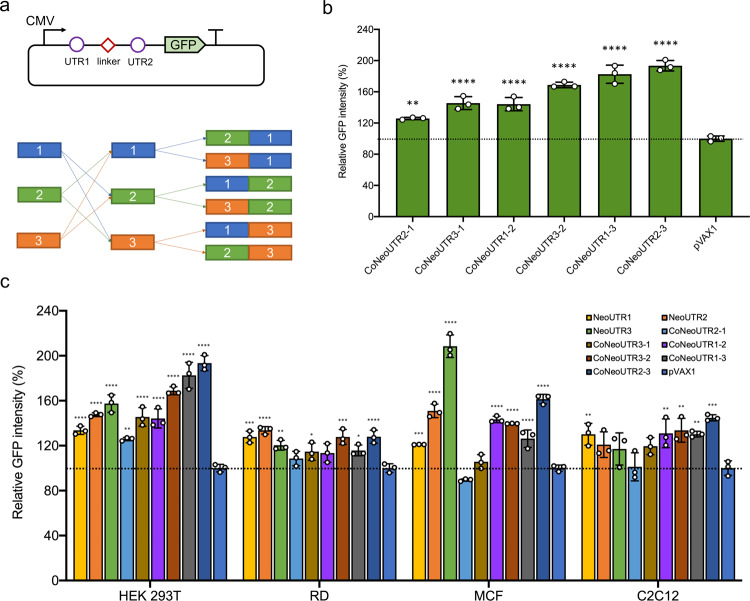
Fig. 5. Effects of combinatorial 5′ UTRs on GFP expression in various cell lines.
a We constructed six distinct 5′ UTR combinations by combining different pairwise permutations of the three validated 5′ UTR candidates with a CAACAA linker between them, and then inserted these combinations into the pVAX1-GFP plasmid directly upstream of the Kozak sequence. b GFP expression from the 5′ UTR combinations on GFP expression in HEK 293T cells. Statistical differences between groups were analyzed by ordinary one-way ANOVA with 95% confidence interval. The relative protein expression was normalized to that from the pVAX1-GFP plasmid, set as 100 (%) and highlighted as a gray dotted line. Data are presented as mean values ± SD for three biological replicates. The p-values for CoNeoUTR2-1, CoNeoUTR3-1, CoNeoUTR1-2, CoNeoUTR3-2, CoNeoUTR1-3, and CoNeoUTR2-3 vs pVAX1 are 0.0025, <0.0001, <0.0001, <0.0001, <0.0001, and <0.0001. c Test of the single and combinatorial 5′ UTRs on GFP expression in various cell lines. Source data are provided as a Source data file. Statistical differences between groups were analyzed by two-way ANOVA with 95% confidence interval. Dunnett test was performed to correct for multiple comparisons in ANOVA post-hoc analysis. The relative protein expression was normalized to that from the pVAX1-GFP plasmid, set as 100 (%) and highlighted as a gray dotted line. Data are presented as mean values ± SD for three biological replicates. In HEK 293T cell lines, the p-values for NeoUTR1, NeoUTR2, NeoUTR3, CoNeoUTR2-1, CoNeoUTR3-1, CoNeoUTR1-2, CoNeoUTR3-2, CoNeoUTR1-3, and CoNeoUTR2-3 vs pVAX1 are <0.0001, <0.0001, <0.0001, 0.0002, <0.0001, <0.0001, <0.0001, <0.0001, and <0.0001. In RD cell lines, the p-values for NeoUTR1, NeoUTR2, NeoUTR3, CoNeoUTR2-1, CoNeoUTR3-1, CoNeoUTR1-2, CoNeoUTR3-2, CoNeoUTR1-3, and CoNeoUTR2-3 vs pVAX1 are <0.0001, <0.0001, 0.0055, 0.5989, 0.0836, 0.1336, <0.0001, 0.0549, and <0.0001. In MCF cell lines, the p-values for NeoUTR1, NeoUTR2, NeoUTR3, CoNeoUTR2-1, CoNeoUTR3-1, CoNeoUTR1-2, CoNeoUTR3-2, CoNeoUTR1-3, and CoNeoUTR2-3 vs pVAX1 are 0.0042, <0.0001, <0.0001, 0.3513, 0.9132, <0.0001, <0.0001, 0.0002, and <0.0001. In C2C12 cell lines, the p-values for NeoUTR1, NeoUTR2, NeoUTR3, CoNeoUTR2-1, CoNeoUTR3-1, CoNeoUTR1-2, CoNeoUTR3-2, CoNeoUTR1-3, and CoNeoUTR2-3 vs pVAX1 are <0.0001, 0.0042, 0.0306, 0.9997, 0.0089, <0.0001, <0.0001, <0.0001, and <0.0001. (*p < 0.05; **p < 0.01; ***p < 0.001; ****p < 0.0001 vs pVAX1).

