Figure 7.
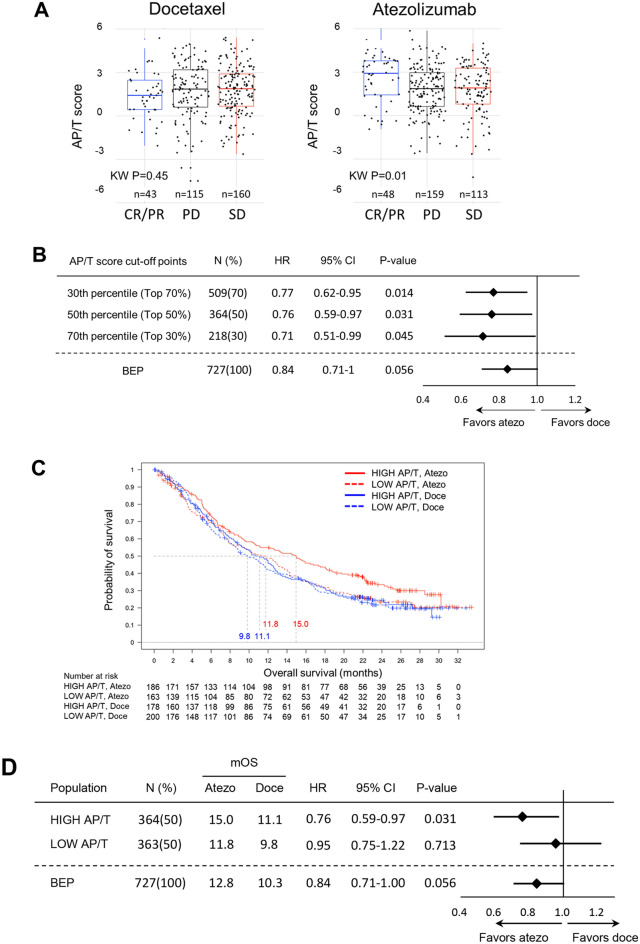
Association of clinical outcome and expression of antigen-presenting DC-related gene and CXCR3 ligands genes in tumor tissue in the phase 3 OAK trial. (A) Relation between overall response rate and AP/T score. (B) Forest plots of hazard ratios (HR) for OS in the biomarker-evaluable population (BEP) and in subgroups with AP/T scores above the 30th, 50th, and 70th percentile cut-off points (top 70%, 50%, and 30% of the population, respectively). (C, D) Kaplan–Meier estimates and forest plots of HRs for OS in the HIGH and LOW AP/T subgroups (cut at 50th percentile) in the atezolizumab and docetaxel treatment arms.

