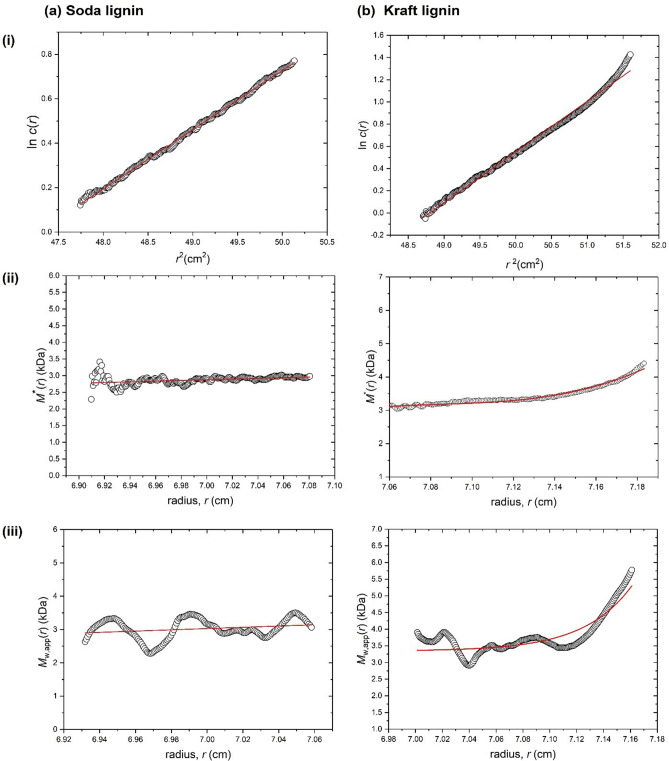
Figure 1.
Sedimentation equilibrium SEDFIT-MSTAR output for the analysis of (a) P1000 soda lignin; and (b) Indulin AT Kraft lignin in DMSO:water (9:1) at 20 °C at loading concentrations of 0.65 mg mL−1 in 12 mm pathlength cells. (i) log concentration, c, versus the square of the radial displacement, r; (ii) extrapolation of the M* function to the cell base to yield the whole distribution apparent weight average molar mass Mw,app; and (iii) plot of the point average molar mass (local molar mass), obtained by taking the derivative of the data from plot (i) versus the local concentration c(r) in the analytical ultracentrifuge cell. The value at the ‘hinge point’ (where c(r) = cell loading concentration) yields the value for the whole distribution Mw values shown in Table 2.

