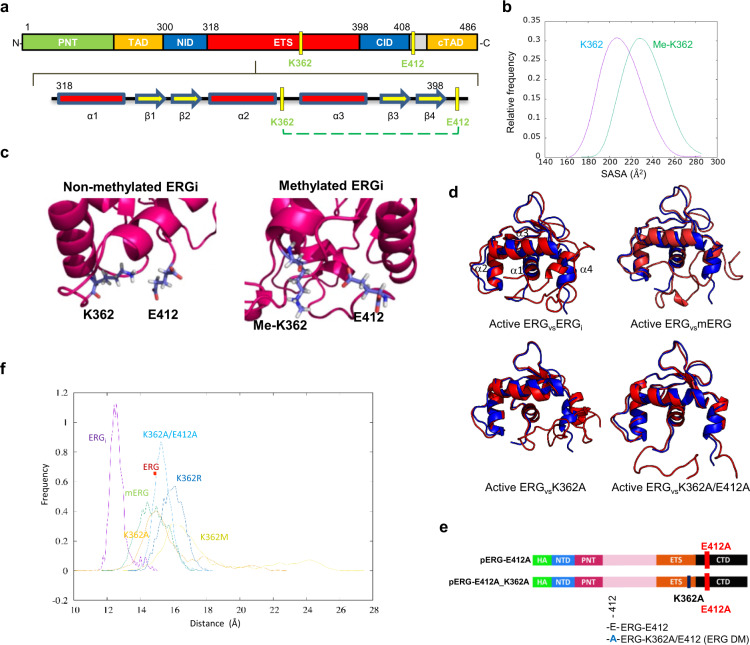
Fig. 2. K362 methylation affects protein conformation.
a ERG domain structure and organization of the ETS DNA binding domain and auto-inhibitory modules. b Solvent accessible surface area for non-methylated (K362) and methylated (Me-K362) form of the ERGi domain. c Representative structures from molecular dynamic simulation of non-methylated (left) and methylated (right) ERGi domain. d Overlay of ERG domain structure of active DNA-bound ERG derived from the X-ray model (blue ribbon) and structures of ERGi, methylated ERG, and indicated ERG mutants derived from molecular dynamic simulations. e Diagram of single (E412A) and double mutant (K362A/E412A) ERG constructs. f Inter-molecular distance in MD simulated ERG domain structures. The distance between residue Leu320 in α1 helix and Ala413 in α4 helix was calculated in all systems over the simulation time to estimate the degree of divergence relative to the active DNA-bound ERG (4iri) structure defined by X-ray crystallography. The same parameter measured in the X-ray structure identified by the pdb code 4iri is depicted as red square. ERGi (Violet), mERG (green), K362A/E412A (light blue) K362A (orange), K362M (yellow), and K362R (blue).

