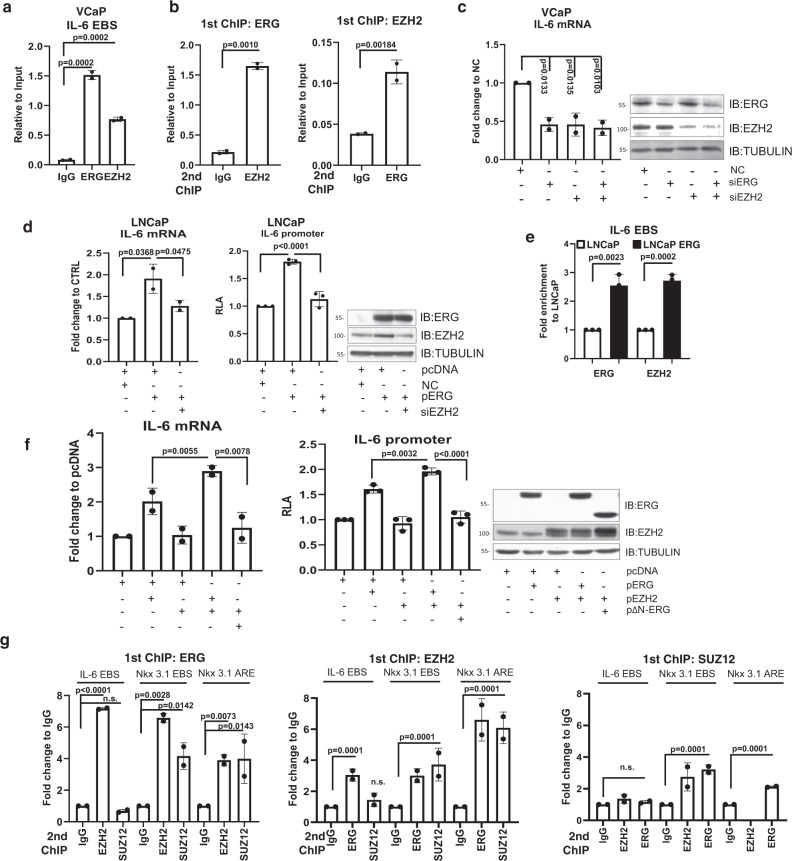
Fig. 4. ERG and EZH2 co-occupy gene promoters forming activatory and repressory complexes.
a ChIP analysis of ERG and EZH2 occupancy on the IL-6 promoter in VCaP cells. Data are presented as fold enrichment relative to input. b ChIP–reChIP analysis of ERG and EZH2 to evaluate co-occupancy at the IL-6 promoter in VCaP cells. Data are presented as fold enrichment relative to input. c qRT-PCR analysis of IL-6 mRNA and immunoblotting analysis of the indicated proteins (right) upon ERG and EZH2 knockdown in VCaP cells. d qRT-PCR analysis of IL-6 mRNA (left) and IL-6 promoter activity by luciferase reporter assay (middle) in LNCaP cells with ERG overexpression and EZH2 knockdown. Expression of the indicated proteins was verified by immunoblotting (right panel). e ChIP analysis of ERG and EZH2 occupancy in the IL-6 promoter at the ETS binding site (EBS) in LNCaP and LNCaP-ERG stable cell lines. f IL-6 mRNA determined by qRT-PCR (left) and IL-6 promoter activity by luciferase reporter assay (middle) in LNCaP transfected with the indicated plasmids. Expression of the indicated proteins was verified by immunoblotting (right). g ChIP–reChIP analysis of EZH2, ERG, and SUZ12 to evaluate co-occupancy at the IL-6 and Nkx3.1 promoters in VCaP cells. Data are presented as fold enrichment relative to IgG of the Re-ChIP. All error bars, mean ± s.d. (n = 3, technical replicates). P-values were determined by one-way ANOVA test. Source data are provided as a Source Data File.

