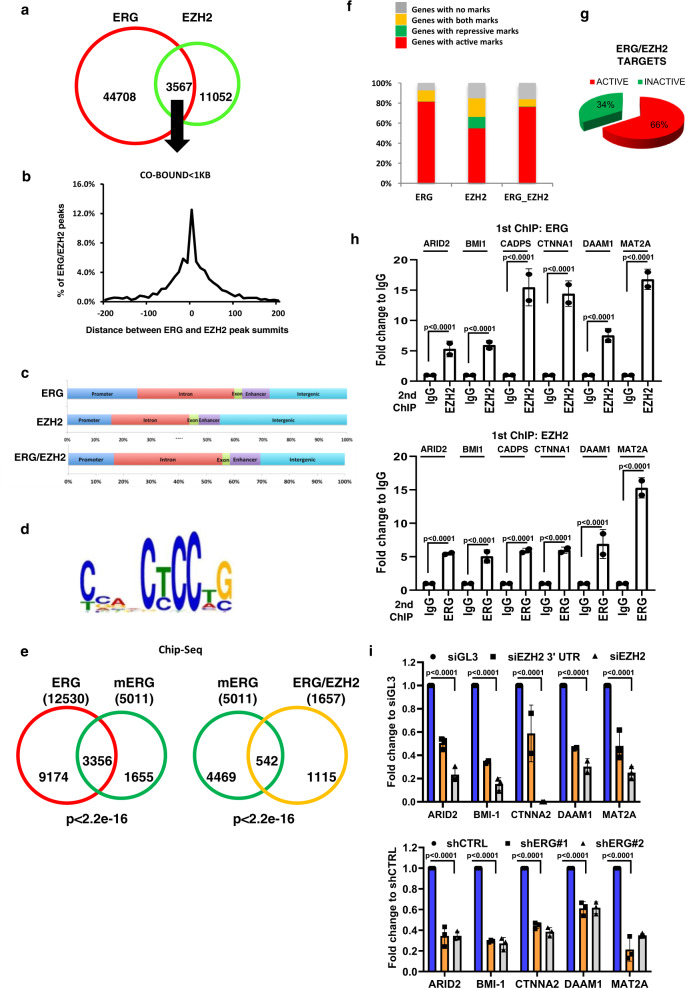
Fig. 5. ERG and EZH2 co-occupy and co-regulate a specific network of genes.
a Venn diagram showing the number of ERG, EZH2, and ERG/EZH2 co-localized peaks (≤1-kb) in VCaP cells extracted by ChIP-seq. b Distance of ERG and EZH2 peaks at ERG/EZH2 co-occupied sites. c Distribution of total ERG and EZH2 (top panel) and ERG–EZH2 co-occupied (lower panel) sites in intergenic, promoter, enhancer, intron, and exon regions. d Enrichment of ERG binding motif at ERG/EZH2 co-occupied sites by de-novo motif analysis. e Venn diagram showing the convergence of ERG and mERG genomic occupancy determined by ChIP-seq in VCaP cells. f Distribution of active and repressive histone marks among ERG, EZH2, and ERG/EZH2 targets. g Pie chart showing percentage of active and inactive genes among ERG/EZH2 targets in VCaP cells. h ChIP–reChIP analysis to evaluate co-occupancy by ERG and EZH2 at the indicated gene promoters in VCaP cells. P-values were determined by unpaired, two-tailed Student’s t-test. i Expression of ERG/EZH2 co-occupied genes after EZH2 (upper) or ERG (lower) knockdown in VCaP cells evaluated by qRT-PCR. All error bars, mean ± s.d. (n = 3, technical replicates). P-values were determined by one-way ANOVA test. Source data are provided as a Source Data File.

