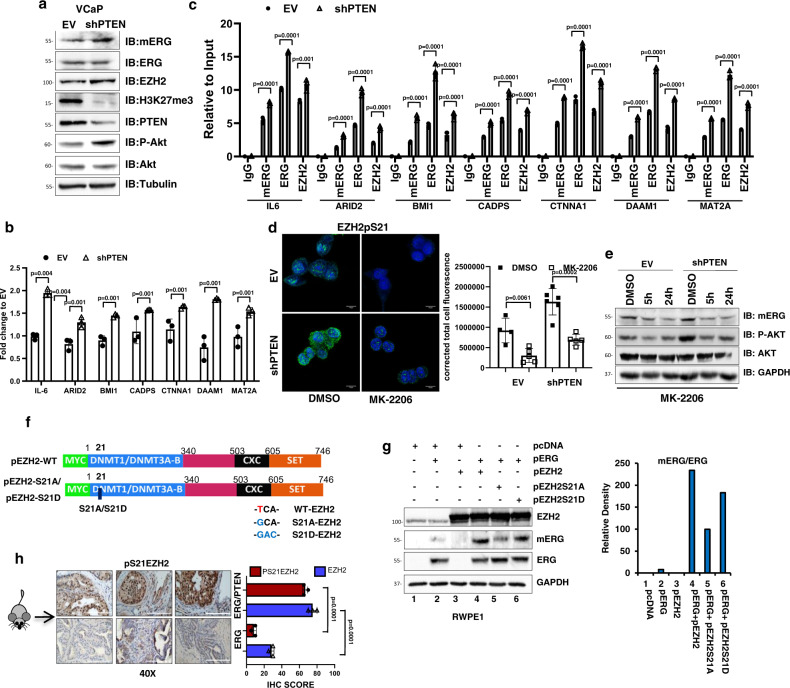
Fig. 7. PTEN deficiency enhances ERG methylation and transcriptional activity.
a Immunoblots of mERG and the indicated proteins in control (EV) and stable PTEN knockdown (shPTEN) VCaP cells (n = 3). b Expression of ERG/EZH2 co-occupied genes in VCaP-shPTEN and control (EV) VCaP cells evaluated by qRT-PCR. c ERG, mERG, and EZH2 occupancy at the indicated gene promoters in VCaP-shPTEN and control (EV) VCaP cells by ChIP-qPCR. d EZH2 phosphorylation (Ps21) evaluated by IF and quantitative assessment (right) in VCaP-shPTEN and control (EV) following treatment with MK-2206 (5 µM) for 24 h. Scale bar 10 µm (n = 2). e Immunoblots of mERG and indicated proteins in VCaP-shPTEN (sh-PTEN) and control (EV) cells treated with DMSO and MK-2206 (5 µM) for 5 and 24 h (n = 2). f Diagram of WT, S21A, and S21D EZH2 mutated constructs. g Immunoblots of mERG and indicated proteins in RWPE1 cells transfected with indicated expression plasmids. Right, densitometric assessment of mERG level relative to total ERG (n = 2). h IHC evaluation of pS21 EZH2 in prostate tissue from ERG (PbCre; ERG flox/flox) and ERG/PTEN (PbCre; ERG flox/flox PTEN flox/flox) mice. Right, quantitative IHC scores of pS21EZH2 and EZH2. All error bars, mean ± s.d. (n = 3, technical replicates) (b, c). P-values were determined by one-way ANOVA test. Scale bars represent 200 µm. Source data are provided as a Source Data File.

