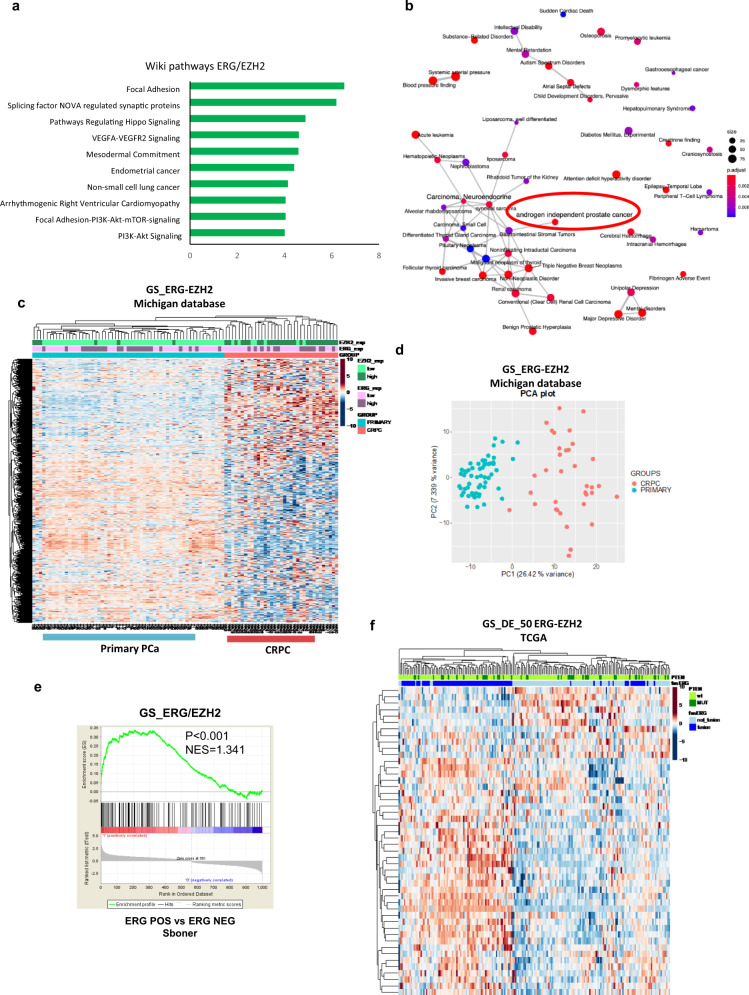
Fig. 8. ERG/EZH2 co-regulated genes are expressed in aggressive prostate tumors.
a Pathways enriched in the list of genes co-occupied by ERG/EZH2 (GS_ERG/EZH2, n = 1656 genes) using enrich tool. b Functional analysis of the GS_ERG/EZH2 set using enrichDGN tool. c, d Heat map (c) and principal component analysis (d) using the GS_ERG/EZH2 set applied to primary prostate tumors (PRIMARY) and castration-resistant prostate cancers (CRPC) with known ERG and EZH2 status in the Michigan dataset. Color bars indicate ERG and EZH2 expression status. e GSEA using the GS_ERG/EZH2 set comparing ERG fusion positive and negative prostate tumors in the Sboner dataset. f Heat map with the top deregulated ERG/EZH2 gene signature (GS_ERG/EZH2_50) applied to the TCGA dataset. Color bars indicate ERG fusion and PTEN status.

