
Figure 5.
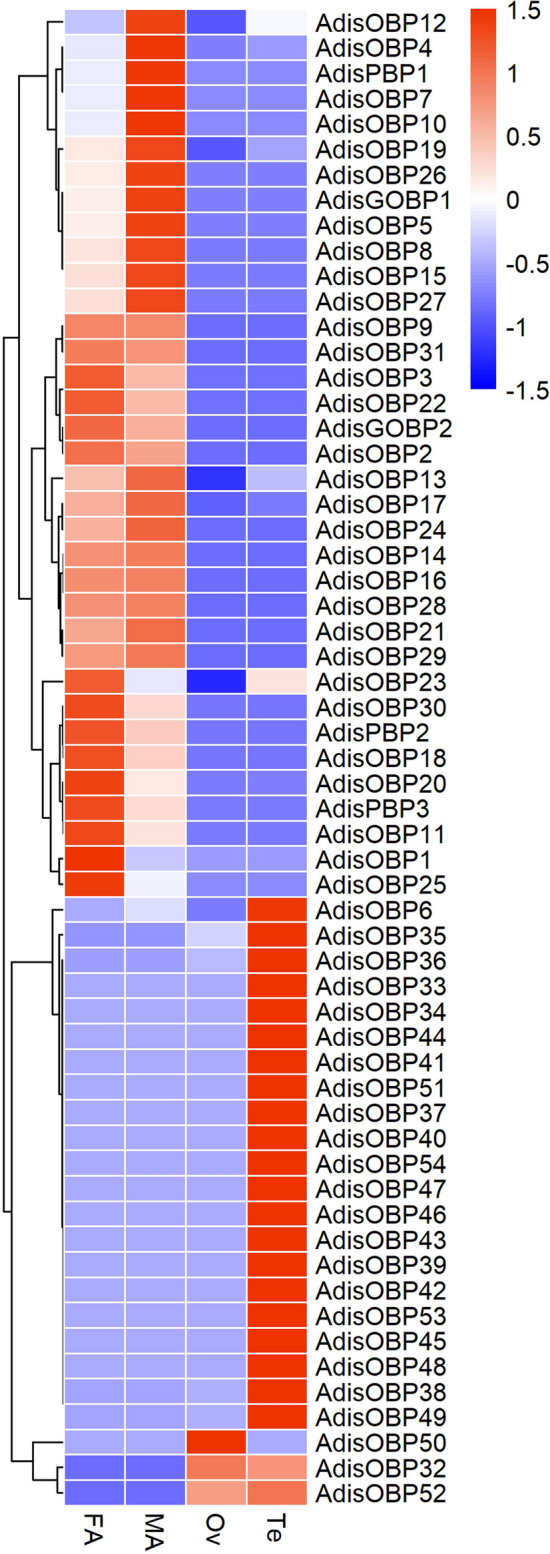
Heat map showing the abundance of unigenes encoding OBPs (including 5 OBPs identified in a previous study) in the Athetis dissimilis different tissues transcriptomes presented as normalized reads in reads per kilobase per million mapped reads (RPKM). In the figure each column represents 1 samples; each line represents 1 OBP gene. The color depth represents the number of reads contained in OBPs; red means more; blue means less. FA female antennae, MA male antennae, Ov ovaries, Te testis.