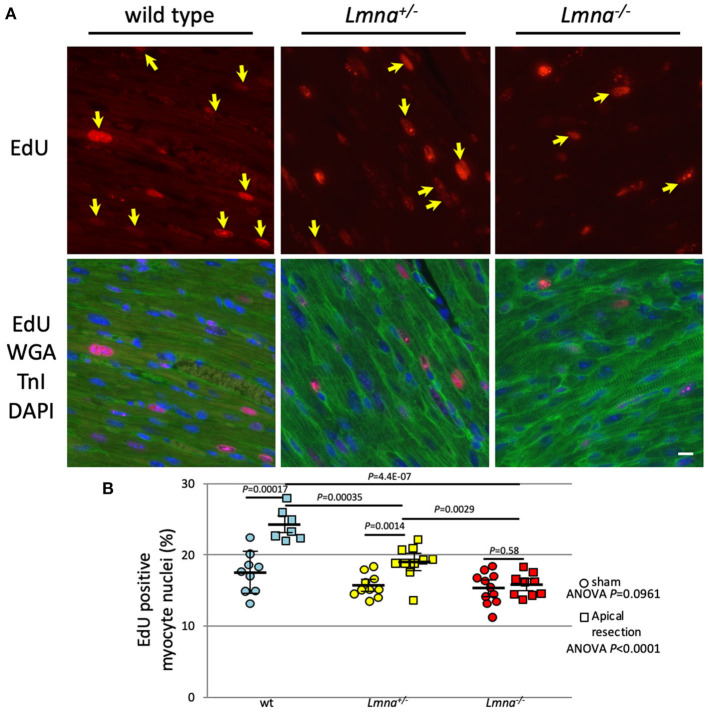
Figure 5.
EdU incorporation and the percentage of EdU positive myocyte nuclei after apical resection. (A) Representative immunostaining for EdU in cardiac tissue sections of wt, Lmna+/−, and Lmna−/−. The top panel shows EdU staining, and the bottom panel shows merged figures of immunostaining for EdU (red), WGA, and troponin I (green) and DAPI (blue). Yellow arrows indicate EdU positive nucleus only in cardiomyocytes. Scale bar: 10 μm. (B) Percentage of EdU incorporated myocyte nuclei (n = 7 to 11 in each group). A circle indicates data from mice with the sham operation, square with apical resection. Dots represent individual mouse data. The significance of differences between 3 groups was determined with 1-way ANOVA. Post-hoc pairwise comparisons were performed with Tukey–Kramer test.

