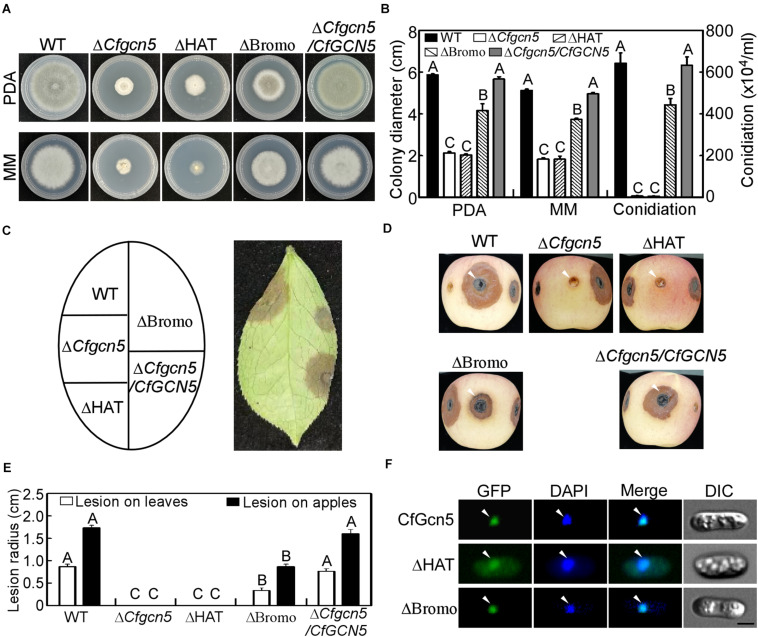
FIGURE 11.
Functional and localized analysis of HAT and Bromo domains. (A) Growth of WT, ΔCfgcn5, ΔHAT, ΔBromo, and ΔCfgcn5/CfGCN5 on PDA and MM plates for 4 days. (B) Colony diameters and conidiation were measured and statistically analyzed by Duncan analysis for different strains. Different letters indicate significant difference (P < 0.01). (C) Diseased symptoms of wounded tea-oil tree leaves inoculated with related mycelial plugs at 4 dpi. (D) Diseased symptoms of wounded apples inoculated with related mycelial plugs at 5 dpi. Arrows indicate the infection area. (E) Statistical analysis of lesion radius on tea-oil tree leaves and apples. Error bars represent SD of three replicates and different letters indicate significant difference (P < 0.01). (F) The localization of deleted HAT domain (ΔHAT) and Bromo domain (ΔBromo). Arrows show the representative co-localized areas. Bar = 5 μm.

