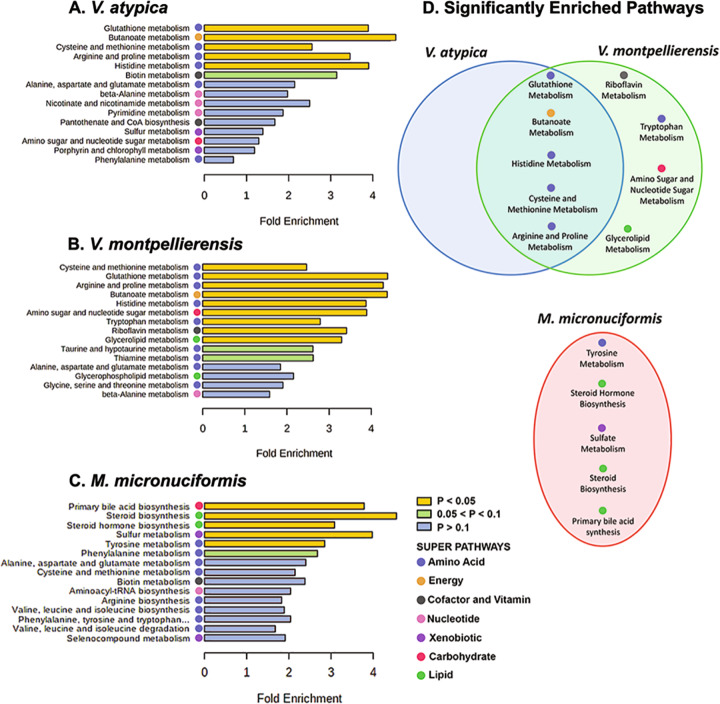
Fig. 4. V. atypica and V. montpellierensis share overlapping enrichment of metabolic pathways belonging to amino acid metabolism that are distinct from M. micronuciformis.
Metabolite pathway enrichment analysis of human 3-D cervical epithelial cells infected with A V. atypica (Supplementary Fig. 3), B V. montpellierensis (Supplementary Fig. 4), and C M. micronuciformis (Supplementary Fig. 5), under anaerobic conditions for 24 h. D Comparison of significantly enriched metabolic pathways between infections. Color bars indicate significance, yellow represents pathways that are significantly enriched (P < 0.05), green indicates pathways that approach statistical significance (0.05 < P < 0.1), and blue indicates pathways that were not significantly enriched (P > 0.1). The super pathway that a particular sub-pathway belongs to is indicated with colored circles.

