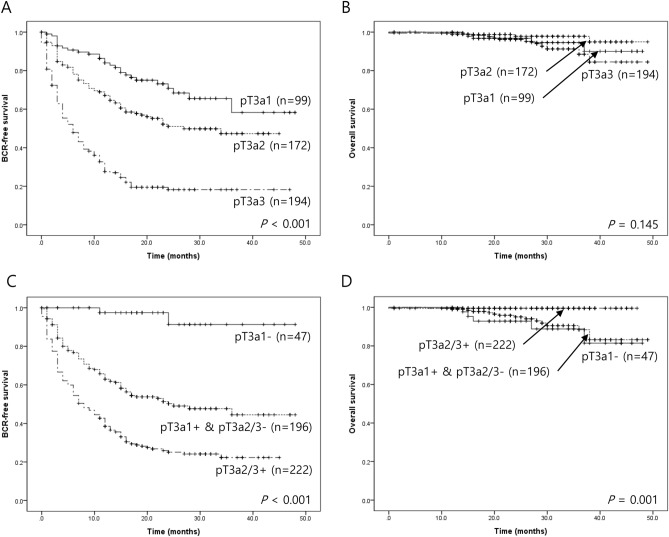
Figure 2.
Kaplan-Meyer survival analysis according pT3a substage and the combination of pT3a substage and circumferential margin (CM) status. (A) The biochemical recurrence (BCR)-free survival was significantly different among pT3a subgroups (P < 0.001). (B) No significant differences were identified in OS (P = 0.145). (C) After the combination of pT3a substage and CM status, significant differences were identified among 3 subgroups (P < 0.001). (D) pT3a2/3 + subgroup showed longer OS than other subgroups (P = 0.001).

