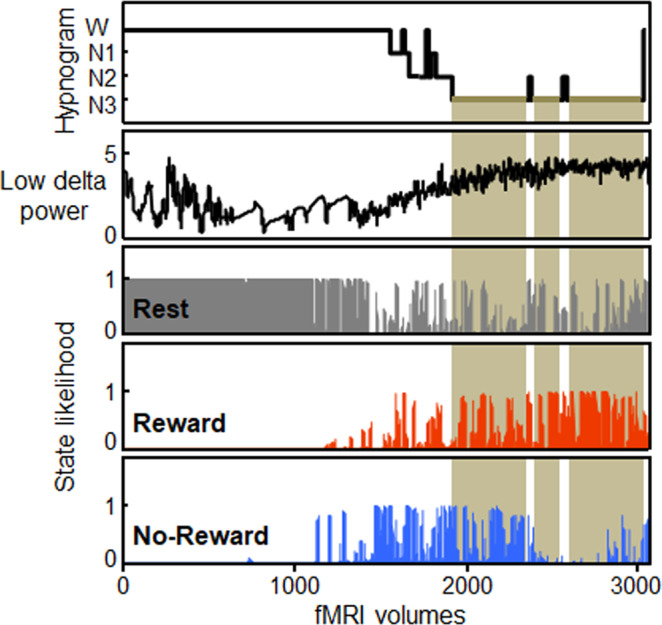
Fig. 2. Data from one representative participant.

From top to bottom: Hypnogram, time course of the log-transformed power values for low delta (1–2 Hz), time-courses of likelihood for the Rest (in gray), Reward (in red), and No-Reward (in blue) brain states (pre-R and pre-NR are not represented here). Periods of N3 are highlighted in light brown. Increased likelihood of the brain state corresponding to the rewarded game is visible during N3. W indicates Wake; N1, N2, N3 indicate N1, N2, N3 sleep stages respectively.
